

Introduction#
In the first part, we introduced the essential tools for firmware debugging and explained how to establish an openOCD connection with the Espressif device.
In this second part, we’ll launch a debugging session, step through the code using navigation commands, and inspect variables in real time. By the end of this tutorial, you’ll have a solid understanding of what a debugger can do and why it’s often the most effective tool for diagnosing and fixing malfunctioning firmware.
In this article, we will:
- Get an overview of the debug window and available commands.
- Learn the differences between key debugging navigation commands.
- Explore the tools available for inspecting variables.
Prerequisites
This article is the second part of a series. For the setup, please refer to the first part.
Debug window overview#
A debugger gives you control over how a program runs, letting you pause execution, inspect variables, and step through code one instruction at a time. This level of control is what sets debugging apart from simply running the program normally.
Breakpoint#
One way to use this control is by stepping line by line through the code, watching how variables change and how the program flows. While this can be helpful, it quickly becomes impractical in larger programs. Instead, it’s often more effective to let the program run freely until it reaches a specific point of interest. That’s where breakpoints come in. A breakpoint pauses execution at a defined line, giving you the opportunity to examine the program’s state and decide what to do next.
Starting a debugging section#
In this first debugging session, we’ll set a breakpoint and reach it using the first navigation command: Continue.
- Open
hello_world_main.cfrom thehello_worldexample project.
If the project isn’t open yet, refer to the first part of this article. - Click on line 24 to set a breakpoint. A red dot will appear next to the line number (see Fig. 1).
- Press
F5(or go to Run → Start Debugging). This starts the debugging session.
If a dropdown menu appears instead, check that alaunch.jsonfile exists in the.vscodefolder. You can find a basiclaunch.jsonhere. - Hit
F5again (Continue) to reach the breakpoint (see Fig.2).
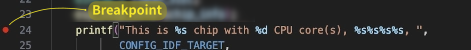
Fig.1 - Breakpoint set
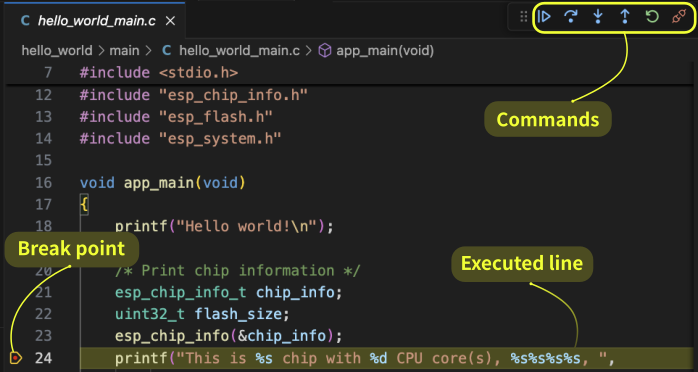
Fig.2 - Debugging session started
Navigation commands explanation#
In the debugging interface, the available commands are located in the top-right corner. They are:
Here’s the polished version of your list:
Continue: Runs the code until the next breakpoint is reached.Step Over: Executes the current instruction or the entire function, then moves to the next instruction at the same level.Step Into: Executes the current instruction (likeStep Over), but if it’s a function call, it enters the function and allows you to debug it line by line.Step Out: Executes the remaining code in the current function and exits to the calling function.Restart: Restarts the debugging session from the beginning.Disconnect: Disconnects fromopenOCD, effectively stopping the debugging session.
All the commands are self-explanatory, except for the subtle yet important difference between Step Over and Step Into.
In other words, Step Into allows you to enter a function call and debug it line by line, while Step Over executes the entire function without stepping into it, moving directly to the next line in the current function.
Navigation commands#
Now, let’s put the navigation commands into action to see how they work in practice.
In the remainder of this section, we will:
- Modify the
hello_world_main.cexample. - Start a new debugging session.
- Explore the difference between
ContinueandStep Over. - Examine the difference between
Step OverandStep Into.
Modifying hello_world_main.c#
Let’s add a simple summation function before the main function void app_main(void):
// Function to calculate the summation of all integers from 1 to 'number'
int summation(int number){
  int sum = 0;
  for(int i=1;i<=number;i++){
    sum += i;
  }
  return sum;
}
And change the void app_main(void) content to
void app_main(void)
{
    printf("Hello world!\n");
    int final_number = 6;
    int sum = summation(final_number);
    printf("The summation up to %d is %d\n",final_number,sum);
}
Your hello_world_main.c should now look like this gist.
Start a new debugging session#
Now, let’s start a new debugging session:
- Save the updated
hello_world_main.cfile. - Set a breakpoint at the line
int final_number=6. - Press
F5to begin the debugging session. Your screen should now resemble Scr.A, as shown in Fig.1.
The debugger stops execution at the beginning of the app_main function and waits for commands.
Continue vs Step Over#
Let’s look at the difference between Continue and Step Over with the help of Fig. 3.
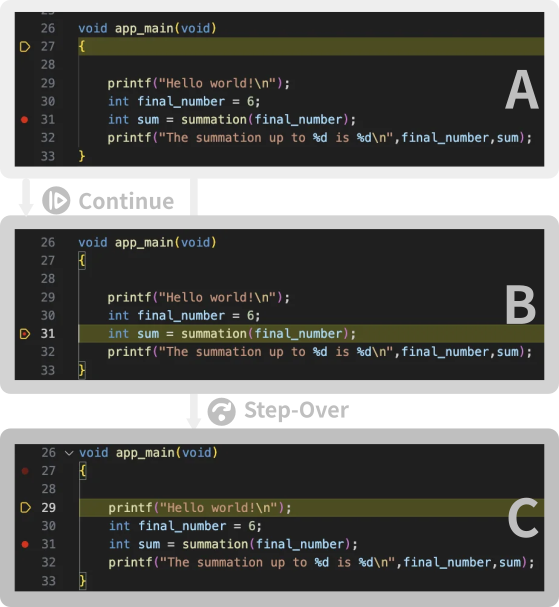
Fig.3 - Continue vs Step-over
Continue(F5) – Scr A → Scr B
Execution proceeds normally until it reaches the breakpoint we previously set.Step-Over(F10) – Scr A → Scr C
The debugger executes the current line and then moves to the next line in the same function.
Before moving on, let’s restart the debugging session.
Restarting the debugging session
- Press ⇧+
F5to exit the debugging session. - Press
F5to enter a new debugging session
We are in Scr A (Fig. 3) again - Press
F5again to reach the breakpoint
We’re now in Scr. B (Fig. 1) which is the same as Scr. α (Fig.4)
Step Over vs Step Into#
Let’s now look at the difference between Step Over and Step Into with the help of Fig. 4.
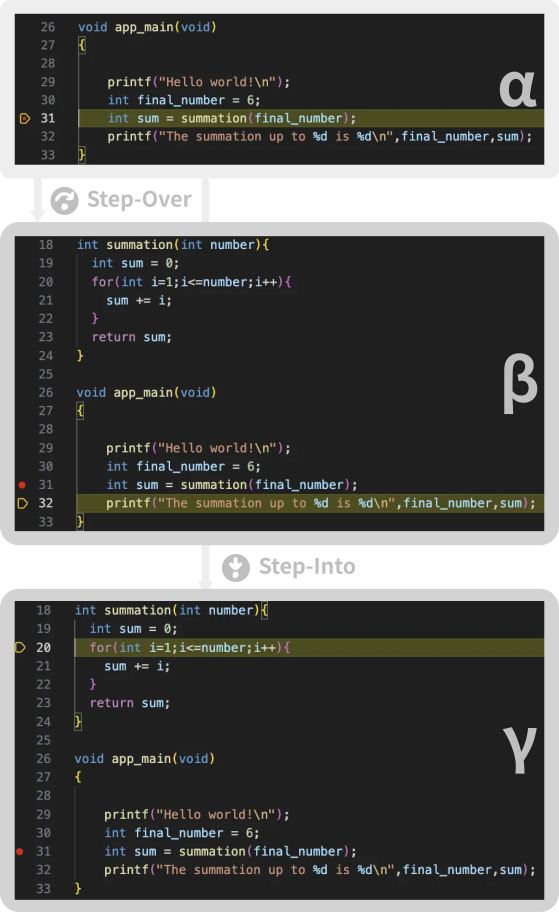
Fig. 4 - Step-over vs step-into
Since the current line in Scr. α involves a function call, it’s the perfect case to highlight the difference between Step Over and Step Into.
Step-over(F10) – Scr. α → Scr. β
The function is executed, and the debugger moves to the next line in the current function.Step-into(F11) – Scr. α → Scr. γ
The debugger steps into the function, allowing you to inspect it line by line.
To continue inspecting the function, you can keep using the Step Over command. When you’re ready to exit the function call, you have two options:
Step Out(⇧+F11) — Scr. β
Executes the remaining lines of the function and resumes at the line following the function call.Continue(F5) — Scr. α
Resumes execution until the next breakpoint is hit.
These navigation commands help you move through your code with precision. Next, let’s look at how to inspect variables during debugging.
Inspecting variables#
So far, we’ve navigated the code flow, but without inspecting variables, it’s hard to grasp what’s really happening.
In this section, we’ll look into the inspecting variables tools with the help of Fig.5.
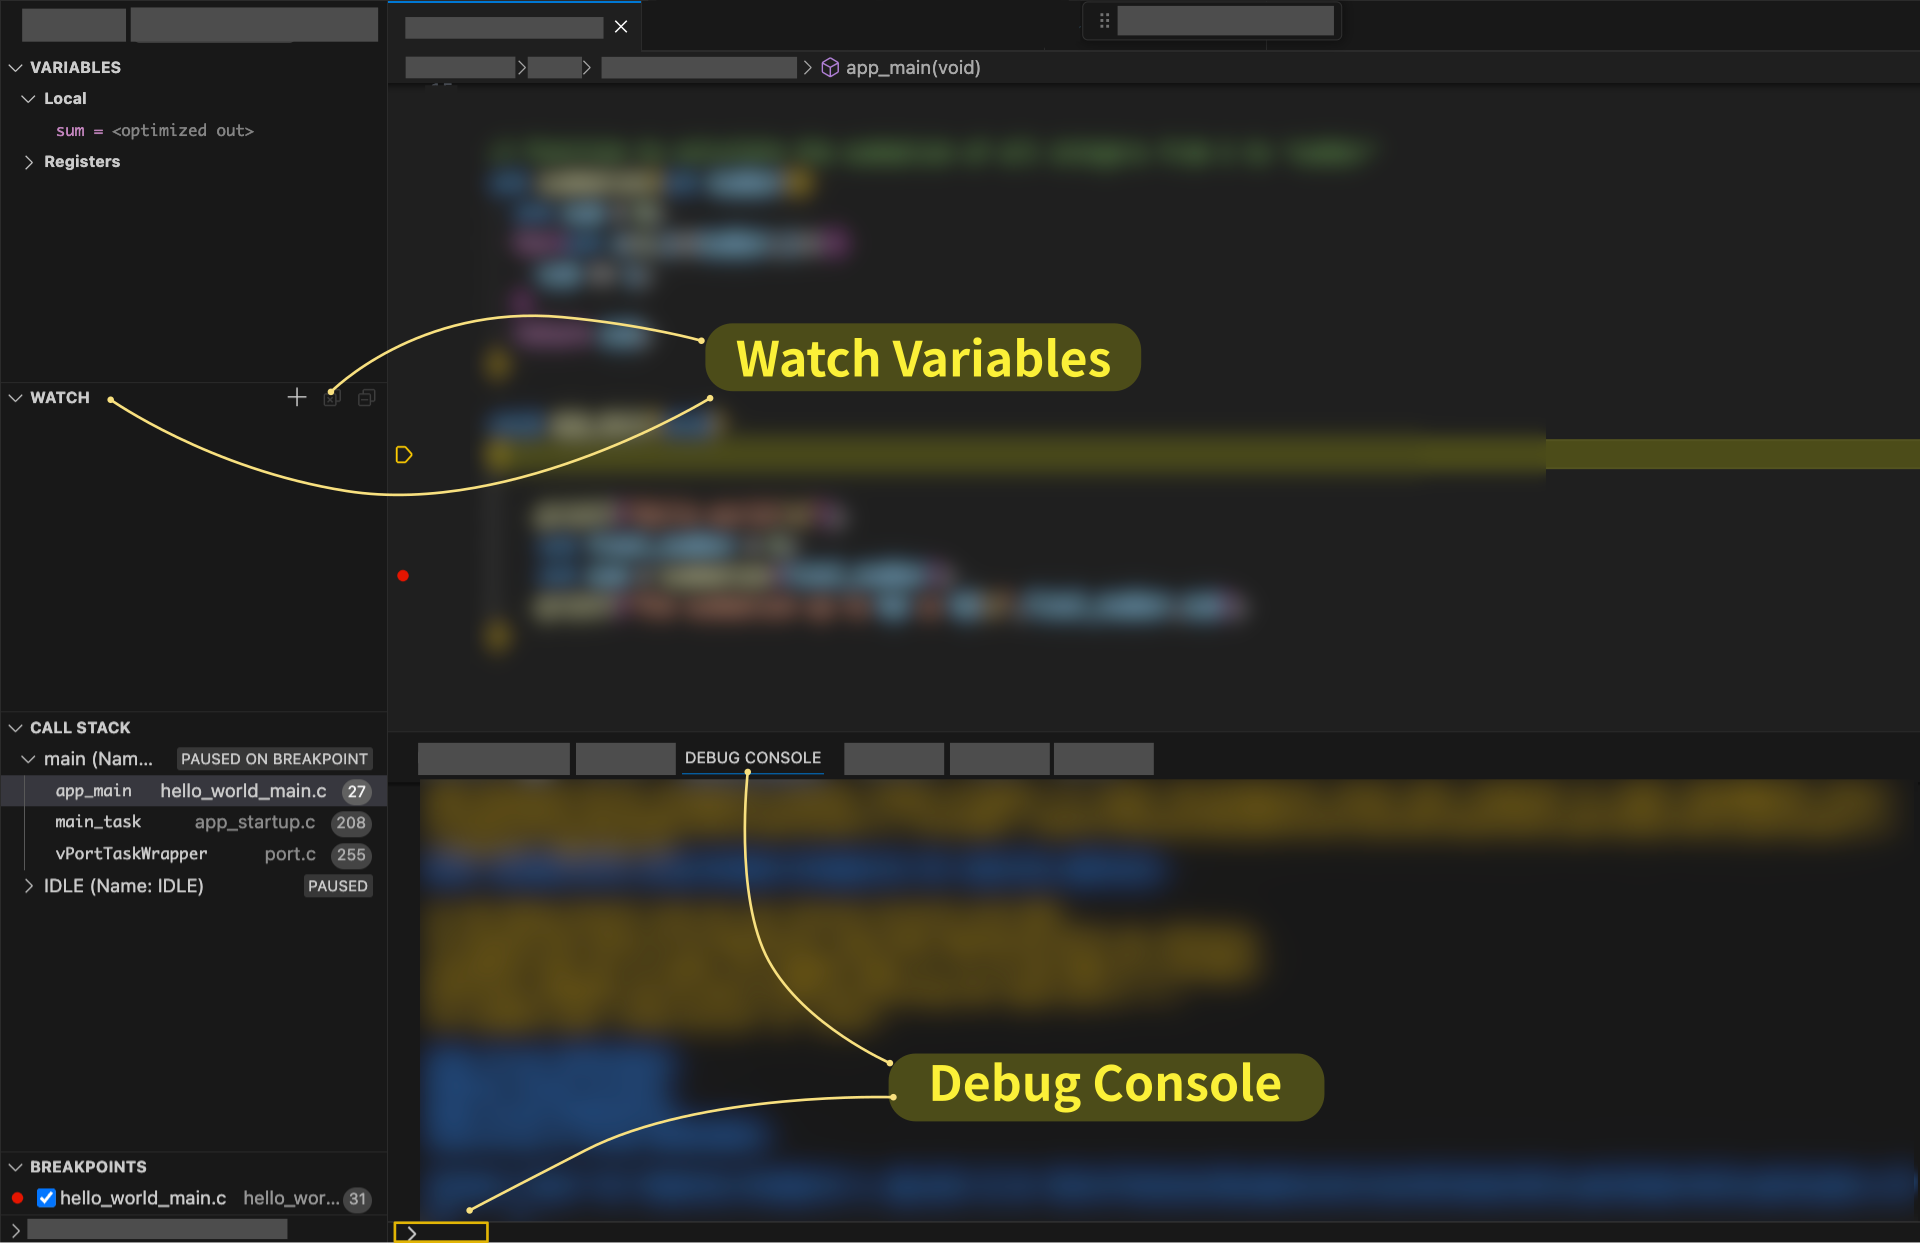
Fig.5 - Variable inspection
Let’s start a new debugging session and reach the line sum += i.
Restarting the debugging session
- Press ⇧+
F5to exit the debugging session. - Set a breakpoint at line
sum += i - Press
F5to enter a new debugging session - Press
F5again to reach the breakpoint
sum +=1 line. The easiest one (followed above) is to set a breakpoint on the line and use Continue.Available inspection tools#
At this point of the code, three variables are defined : number, i and sum. The next step is to read their value.
You can inspect the variable in three places:
- In the VARIABLES pane under Local on the left (see Fig 5)
- In the DEBUG CONSOLE, by typing the variable name and hitting
Enter⏎ - By adding them to the WATCH pane
VARIABLES displays all variables currently defined in the function scope, including local variables, global variables, and register values.
DEBUG CONSOLE is the most convenient tool for quick inspections. Use it to evaluate expressions and examine memory.
WATCH is useful for monitoring variables and expressions you want to track. Just click the + icon on the right side of the pane (see Fig. 5).
VARIABLES pane#
When the breakpoint is first reached, VARIABLES → Local displays:
sum = 0
i = 1
Remember, the core hasn’t executed the highlighted line yet—that’s why sum is still 0.
Pressing Continue (F5) again results in what we expect to see:
sum=1
i=2
DEBUG console#
Among the available methods to view variable values during execution, the DEBUG CONSOLE — highlighted at the bottom of Fig.5 - is the most flexible.
At any moment during the debugging session, you can write an expression in the DEBUG CONSOLE which is evaluated when hitting Enter ⏎.
Type (sum+1)*2 on the DEBUG CONSOLE (next to the > sign, as shown in Fig. 5). As expected, you will get 4.
WATCH pane#
As a final step, let’s explore the WATCH tool. It allows you to enter full expressions, just like in the DEBUG CONSOLE. These expressions are saved and automatically evaluated in every debugging session, with their current values shown.
To see the WATCH pane in action:
- Click
+on the right side of WATCH pane. A text input “Expression to watch” appears. - Type
sum*suminside of the text input - Start a new session (⇧+
F5followed byF5) - Hit
F5again to reach the breakpoint
In the WATCH pane a sum*sum= 0 appeared.
This field is updated according to the expression value. Press F5 repeatedly to generate the sequence 0, 1, 9, 36, ... which corresponds to the square of the sum.
Conclusion#
In this second part, we explored the various functions of the debugger. We first examined different ways to navigate through the code and highlighted the differences between Continue, Step-into, and Step-over. Then, we focused on tools for inspecting variables, including the DEBUG CONSOLE, the VARIABLES pane, and the WATCH tool. With these tools at your disposal, you’re now equipped to enhance your coding efficiency, identify issues more easily, and improve the overall quality of your code.