

Introduction#
The most straightforward way to see what your C program is doing is to drop in a few printf statements. It’s simple, immediate, and every developer knows how to use it. But as soon as your application grows beyond a toy example, printf starts to show its limits: output becomes messy, important details get buried, and managing those statements turns into a chore. Using a logging library, on the other hand, gives you structured, configurable, and context-rich feedback without scattering prints all over your code.
It lets you control what gets recorded, where it goes, and how it looks, all while keeping your source clean. Additionally, logging can be easily disabled in production builds via a configuration option, so you don’t have to worry about performance or leaking sensitive information. In the sections that follow, we’ll refer to the logging library simply as “logging,” and we’ll explore why it is better than printf for debugging, as well as how adopting it can make your codebase easier to maintain and scale.
Logging library#
The ESP-IDF provides its logging functionality through the log component, included via esp_log.h. You’ve probably already seen this logging in action, as it’s used extensively throughout the ESP-IDF libraries.
ESP-IDF offers two logging implementations: Log V1 and Log V2, selectable through CONFIG_LOG_VERSION. Log V1 is the simpler, default option optimized for early and DRAM logging but with higher flash usage and limited flexibility, while Log V2 reduces flash usage, adds powerful customization features, and centralizes formatting at the cost of slightly higher stack usage. In this article, we will focus on Log V1, while Log V2 will be covered in a future article.
Let’s examine the output from the hello_world example. When you monitor your device while running hello_world, you’ll see something like:
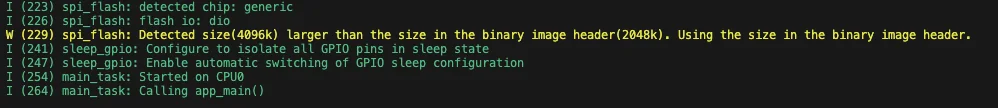
Fig.1 - Hello World output
Lines starting with I are shown in green, while those starting with W appear in orange. These are examples of log messages: I denotes an informational message, and W denotes a warning. Although both are essentially printed messages with some extra formatting, they represent conceptually different types of messages. Their visibility can be controlled through a configuration parameter called verbosity.
Logging core elements#
To grasp how logging works in ESP-IDF, we will examine its three core elements:
- Tags
- Logging macros
- Verbosity levels
Tags#
A tag is simply a string used to group related log messages, typically by file or component. Tags are passed to the logging macros, as demonstrated in the next section. A common convention is to define a TAG constant as a static const char * pointer. In ESP-IDF, tags are usually declared at the top of the file like this:
static const char *TAG = "TAG_NAME";
static keyword limits the symbol’s visibility to the current file, while const ensures the string is stored in read-only memory instead of consuming RAM.Logging macros#
ESP-IDF offers a powerful logging system through the ESP_LOGx family of macros that are used for reporting errors, warnings, and other runtime information. These macros are task-safe, lightweight, and can be grouped per tag.
The available macros are:
ESP_LOGE– ErrorESP_LOGW– WarningESP_LOGI– InfoESP_LOGD– DebugESP_LOGV– Verbose
Here is a sample showing how to use one of these macros in your code:
ESP_LOGE(TAG, "Failed to initialize sensor: %s", esp_err_to_name(ret));
Each logging macro takes two main arguments:
- Tag - the label under which the log will be grouped.
- Message – a
printf-style format string followed by variadic arguments.
Verbosity#
The difference between the logging macros is not just visual, it’s also tied to the verbosity level. Verbosity levels determine which messages are actually printed to the serial console.
The reason why it’s possible to change the verbosity is that reducing it in ESP-IDF (e.g., via CONFIG_LOG_DEFAULT_LEVEL) provides several advantages:
- Smaller binary size: Fewer log strings and logging calls reduce the compiled code size.
- Lower CPU load: With fewer logs generated, the CPU spends less time formatting and outputting messages, improving runtime performance.
- Reduced memory usage: Less memory is needed for log strings and temporary buffers, which helps applications with tight memory limits.
These optimizations make logging more efficient without losing control over critical messages.
The esp_log component supports the following levels, from lowest to highest:
- No output
- Error
- Warning
- Info
- Debug
- Verbose
This order matters: for example, ESP_LOGE messages will appear even at the lowest verbosity setting that allows output, while ESP_LOGV messages are only shown when verbosity is set to the highest level.
You can change the default verbosity level in menuconfig:
> ESP-IDF: SDK Configuration Editor (menuconfig)
→Component Config Log Level→Default Log Verbosity
Fig.2 illustrates how different verbosity settings affect which log messages are shown. The default verbosity level is info.
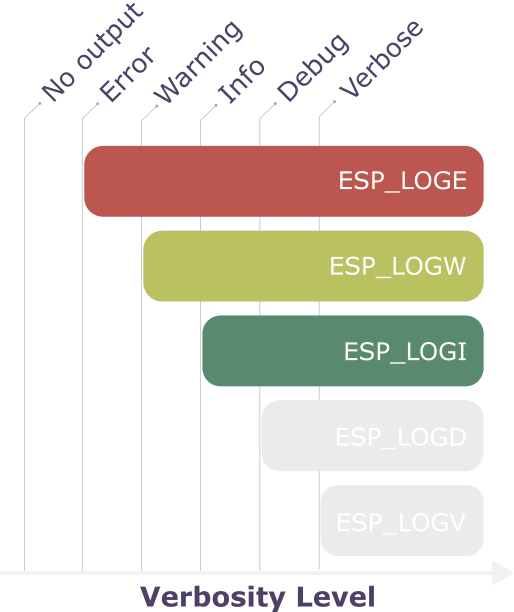
Fig.2 - Logging diagram
Filtering Logs#
ESP-IDF gives you fine-grained control over log output, allowing you to filter messages by verbosity level and tag. You can do this both at runtime in your application and from the host using the IDF monitor.
Filtering at Runtime#
You can also adjust log verbosity directly within your application using the esp_log_level_set() function:
esp_log_level_set("TAG", ESP_LOG_WARN); // Only warnings and errors for "TAG"
esp_log_level_set("TAG", ESP_LOG_NONE); // Disable all logs for "TAG"
This makes it possible to dynamically change log levels for specific modules or components while your program is running.
Filtering in the IDF Monitor#
When using the IDF monitor, you can control which logs are displayed by filtering them by tag and verbosity level. This can be done with the --print-filter option or by setting the ESP_IDF_MONITOR_PRINT_FILTER environment variable. All logs are still transferred to the host over the serial port, but only those that match the filter are shown.
A filter is defined as a series of <tag>:<log_level> pairs, where <log_level> can be one of:
N(None)E(Error)W(Warning)I(Info)D(Debug)V(Verbose)*(all)
For example you can write
idf.py monitor --print-filter="tag1:W"
Shows only warnings and errors for tag1.
idf.py monitor --print-filter="tag1:I tag2:W"
Shows tag1 logs at Info level or less, and tag2 logs at Warning level or less.
If no log level is specified, the default is verbose. You can also define global filters. For instance, *:E displays only errors across all tags.
*, or colons :.
More details: ESP-IDF Monitor Output Filtering.Putting it all together#
Let’s try out the logging system in practice. We’ll start from a bare-bones example available on this GitHub repository.
The main.c file for this example looks like this:
#include <stdio.h>
#include "sdkconfig.h"


void app_main(void)
{
    printf("Hello tutorial!\n");
}
In this section we will
- Assign a tag to the logs (i.e.
TAG) - Log a message for each level
- Change verbosity level and check the output
Assign a tag to the logs#
When using a logging macro, the first argument is a tag that groups related log messages. You can pass a string literal directly, but it’s usually better to define a constant and reuse it throughout the same component or file.
In our example, we’ll use:
static const char *TAG = "APP_MAIN";
Log a message for each level#
Before using the log macros, include the esp_log.h header:
#include "esp_log.h"
Next, replace the app_main function with the following:
void app_main(void)
{
    printf("\n\n\n*** STARTING LOGS ***\n\n");
    ESP_LOGE(TAG, "Log ERROR!");
    ESP_LOGW(TAG, "Log WARNING!");
    ESP_LOGI(TAG, "Log INFO!");
    ESP_LOGD(TAG, "Log DEBUG!");
    ESP_LOGV(TAG, "Log VERBOSE!");
    printf("\n\n\n*** ENDING LOGS ***\n\n\n");
}
printf statements are used simply to separate the logs we created from the default ESP-IDF logs.Now, build, flash, and monitor the code:
> ESP-IDF: Build, Flash and Start a Monitor on Your Device
The relevant output is shown in Fig. 3.
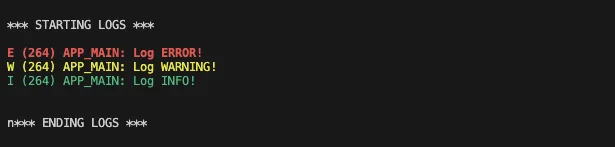
Fig.3 - Logging output - Info level
You can see that the error log appears in red, the warning log in yellow, and the info log in green. The debug and verbose logs are missing because the current verbosity level does not allow them to be displayed.
Change verbosity level and check the output#
Let’s inspect the current verbosity level in menuconfig:
> ESP-IDF: SDK Configuration Editor (menuconfig)
→Component Config→Log Level→Default Log Verbosity
The dropdown menu (see Fig. 4) lists all available levels. By default, it is set to info.
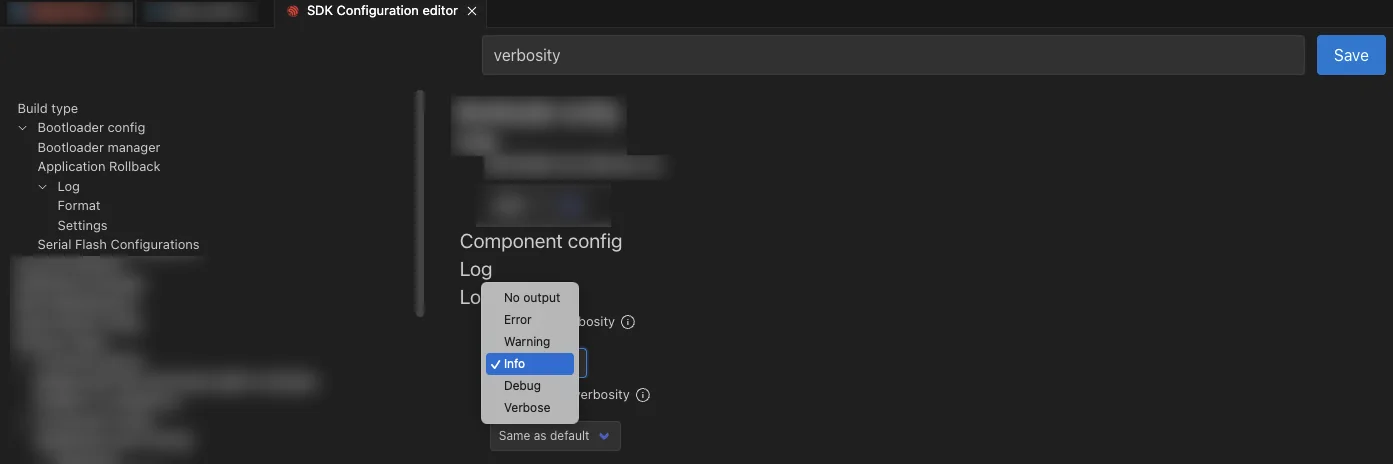
Fig.4 - Choosing verbosity level
Now, let’s see what happens when we increase the verbosity:
Change the dropdown value to
verboseSave the configuration
Build, flash, and start the monitor:
> ESP-IDF: Build, Flash and Start a Monitor on Your Device
As expected, all log levels are now displayed, as shown in Fig. 5.
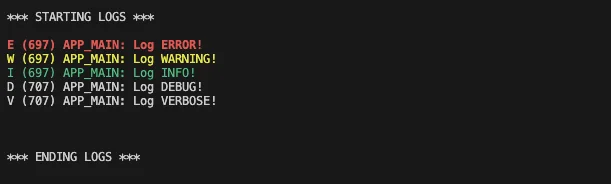
Fig.5 - Logging output - Verbose level
Note that the ESP_LOGD and ESP_LOGV messages appear in white, similar to printf.
No output in the dropdown menu.Change verbosity at runtime#
You can also adjust the logging verbosity while your program is running.
Update your app_main function as follows:
void app_main(void)
{
    printf("\n\n\n*** STARTING LOGS ***\n\n");
    ESP_LOGE(TAG, "Log ERROR!");
    ESP_LOGW(TAG, "Log WARNING!");
    ESP_LOGI(TAG, "Log INFO!");
    ESP_LOGD(TAG, "Log DEBUG!");
    ESP_LOGV(TAG, "Log VERBOSE!");

    esp_log_level_set("main", ESP_LOG_WARN);

    ESP_LOGE(TAG, "Log ERROR after set level");
    ESP_LOGW(TAG, "Log WARNING set level");
    ESP_LOGI(TAG, "Log INFO set level");
    ESP_LOGD(TAG, "Log DEBUG!");
    ESP_LOGV(TAG, "Log VERBOSE!");
    printf("\n\n\n*** ENDING LOGS ***\n\n\n");
}
In this example, we first print all log levels, then change the verbosity level of the main component to WARN. After that, only warnings and errors will appear in the output.
Build, flash, and monitor your device:
> ESP-IDF: Build, Flash and Start a Monitor on Your Device
Your output should now look similar to Fig.5.
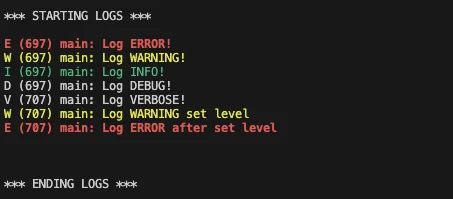
Fig.5 - Runtime filtering
As you can see, the configuration log level is set to verbose, so in the first block all messages—including verbose—are printed. After calling esp_log_level_set, the log level for the main component is reduced to warning, so only warnings and errors are displayed from that point on.
Filtering with esp-idf monitor#
As a last step, let’s use the idf.py monitor to filter only the logs with tag “main” and just the ones with verbosity level less than info.
> ESP-IDF: Open ESP-IDF Terminal- In the terminal type:
idf.py monitor --print-filter="main:I"
The output should look like Fig. 6.
Fig.6 - idf.py monitor filtering
In this case, even though the verbosity level is set to verbose, the monitor filters out all messages with the main tag below info.
In this example, this process is equivalent to setting the verbosity level to info in menuconfig. However, when working with multiple components, you can set a different displayed verbosity level for each one individually.
Conclusion#
In this article, we explored the ESP-IDF logging system, showed how to define a module tag, used the ESP_LOGx macros for different severity levels, and adjusted verbosity to control which messages to display.
We also demonstrated how to change log levels at runtime and filter messages in the IDF monitor, giving developers fine-grained control over log visibility and improving both development efficiency and application performance.
Unlike printf, logging provides structured, context-rich output that can be filtered by level, grouped by module, and disabled in production, making debugging and monitoring much easier.
Further Reading#
- For a deeper dive into the logging library, see the ESP-IDF Programming Guide.
- To explore all host-side filtering options, refer to the IDF Monitor documentation.