

Introduction#
ESP-IDF VS Code Extension v2.3.0 has been released! It introduces new features and many improvements. If you encounter an issue or have improvement ideas, please share them as a GitHub issue.
This article covers the following key features:
- AI Chat task output integration
- Build, flash, and monitor a single partition
- Espressif MCP Servers
- Improved debug symbol resolution
For other updates, see the v2.3.0 release notes. Now let’s take a closer look at the key features.
AI Chat task output integration#
In Visual Studio Code, you can enable Chat and connect it to Copilot, another AI provider, or your own models. Read more in the VS Code guide to enabling AI features and the AI Chat view documentation.
Since the v1.11.0 release, the extension has supported running ESP-IDF commands directly from Chat and viewing their output there. You can build a project by typing build the project or #espIdfCommands build in Chat. For more information about these and other Chat commands, see the Language Tools documentation.
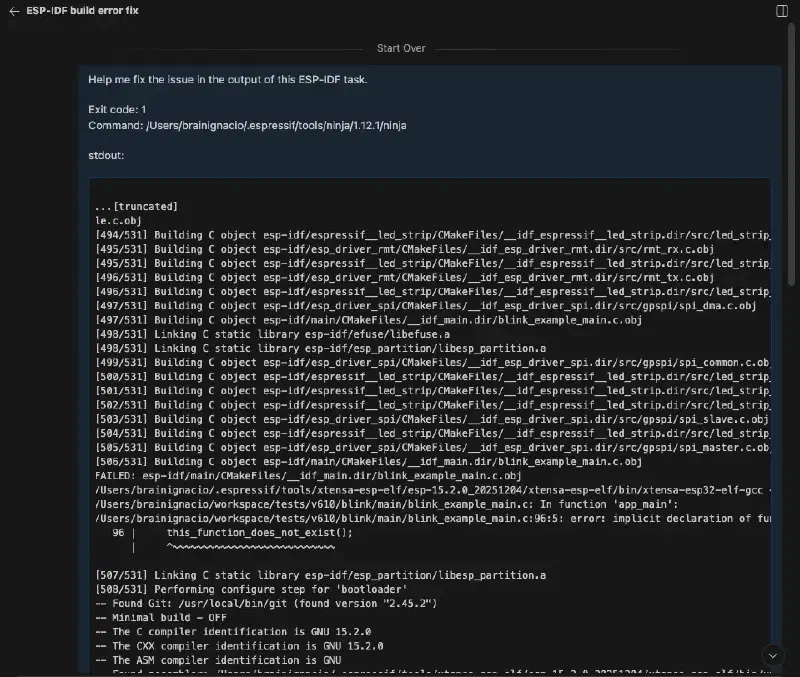
In v2.3.0, commands such as ESP-IDF: Build your project offer AI troubleshooting when a task fails. Select Ask AI to fix in the task output notification to open a new VS Code Chat view with the task output included in a prompt to help diagnose the issue.
An example of this is shown below:
- Open an ESP-IDF project with a build error in Visual Studio Code or Cursor. For example, call a function that doesn’t exist in
main(). - Run the
ESP-IDF: Build your project(the icon in the status bar).
 - The build task will start and reach a point of failure. Then a notification will appear:

- Press Ask AI to fix. A new AI Chat view opens with the task output included in a prompt to help diagnose the issue.
Build, flash, and monitor a single partition#
The "idf.partitionToUse" ESP-IDF extension setting selects the partition to use: app, bootloader, or partition-table. When you run ESP-IDF: Build, Flash and Start a Monitor on Your Device (the  status bar icon), the command builds the project, flashes the selected partition, and starts a monitor session.
For example, when "idf.partitionToUse": "app", the ESP-IDF: Build, Flash and Start a Monitor on Your Device command builds and flashes only the app partition, then starts a monitor session.
In v2.3.0, we introduced the ESP-IDF: Build App, Flash App and Start Monitor command. It performs these tasks for the App partition without requiring you to set "idf.partitionToUse" in your settings.json. Building or flashing only the partition affected by your changes can reduce task time.
If you just want to build or flash one of these partitions, several commands are also available:
- ESP-IDF: Build App Only
- ESP-IDF: Build Bootloader Only
- ESP-IDF: Build Partition Table
- ESP-IDF: Flash App Only (UART)
- ESP-IDF: Flash Bootloader Only (UART)
- ESP-IDF: Flash Partition Table (UART)
Espressif MCP servers#
The Model Context Protocol (MCP) is an open standard that lets AI models connect to external tools, including those in the Espressif MCP Servers collection. As described in the ESP-IDF VS Code extension Language Tools documentation, the extension registers remote MCP servers so the VS Code Chat view can call Espressif tools without a separate mcp.json entry.
The following HTTP servers are contributed:
- Espressif Documentation — semantic search over official Espressif documentation in English and Chinese (search_espressif_sources).
- ESP Component Registry — search components and fetch component documentation.
These servers do not require a local ESP-IDF project. They are registered when the extension loads, unless idf.extensionActivationMode is set to never in your VS Code settings.json.
Here are the steps to enable them:
- Run MCP: List Servers from the Command Palette.
- If they are not already running, start both entries:
Espressif DocumentationandESP Component Registry. - VS Code opens a browser for authentication. Sign in with a GitHub or WeChat account. Only an anonymized account ID is used to enforce rate limits. See Espressif Documentation MCP Server.
- If the Component Registry server also requests authentication, complete that prompt the same way.
- Open Chat (
View>Chat) to start a chat session.
After login, the Chat can use the documentation search and component registry tools together with the ESP-IDF command tool described above.
Improved debug symbol resolution#
During a debug session, users could see ?? Unknown Source in the call stack or an error saying the bounds of the current function could not be found.

Previously, you had to configure launch.json manually to include ROM symbols.
{
  "version": "0.2.0",
  "configurations": [
    {
      "type": "gdbtarget",
      "request": "attach",
      "name": "Eclipse CDT GDB Adapter",
      "imageAndSymbols": {
        "symbolFileName": "/home/user/.espressif/tools/esp-rom-elfs/20241011/esp32s3_rev0_rom.elf",
        "symbolOffset": "0"
      }
    }
  ]
}
or run this gdb command in the VS Code debug console:
add-symbol-file /home/user/.espressif/tools/esp-rom-elfs/20241011/esp32s3_rev0_rom.elfThe debug adapter now loads the ESP-IDF project’s gdbinit files from its build directory when you start a debug session. These files contain GDB configuration instructions and symbol information that help resolve source locations without requiring manual setup.