This tutorial shows how to work with an ESP-IDF project in CLion, a cross-platform C and C++ IDE. We’ll build an application, flash it to an ESP32-S3 board, and debug it. We’ll also run the serial monitor and examine the configuration menu that allows you to customize your ESP-IDF project. All of this will be done within the IDE, without having to switch to a system terminal or any other tool.
The tutorial is beginner-friendly, so it’s okay if you’ve never worked with ESP-IDF and CLion.
Prerequisites#
We’ll use the following hardware:
- ESP32-S3-DevKitC-1 v1.1.
- MacBook Pro M2 Max.
- USB-C to micro USB data cable.
To get started:
- Install the ESP-IDF toolchain.
- Install CLion. You can use the free 30-day trial version. Be sure to check whether there are any discounted or free options available.
Although we’ll be running CLion on macOS, the workflow and settings are generally similar to those for Windows and Linux, except in cases mentioned in this article. If you want to learn more about the configuration options available in CLion beyond those demonstrated in this tutorial, refer to the CLion documentation.
Configuring an ESP-IDF project#
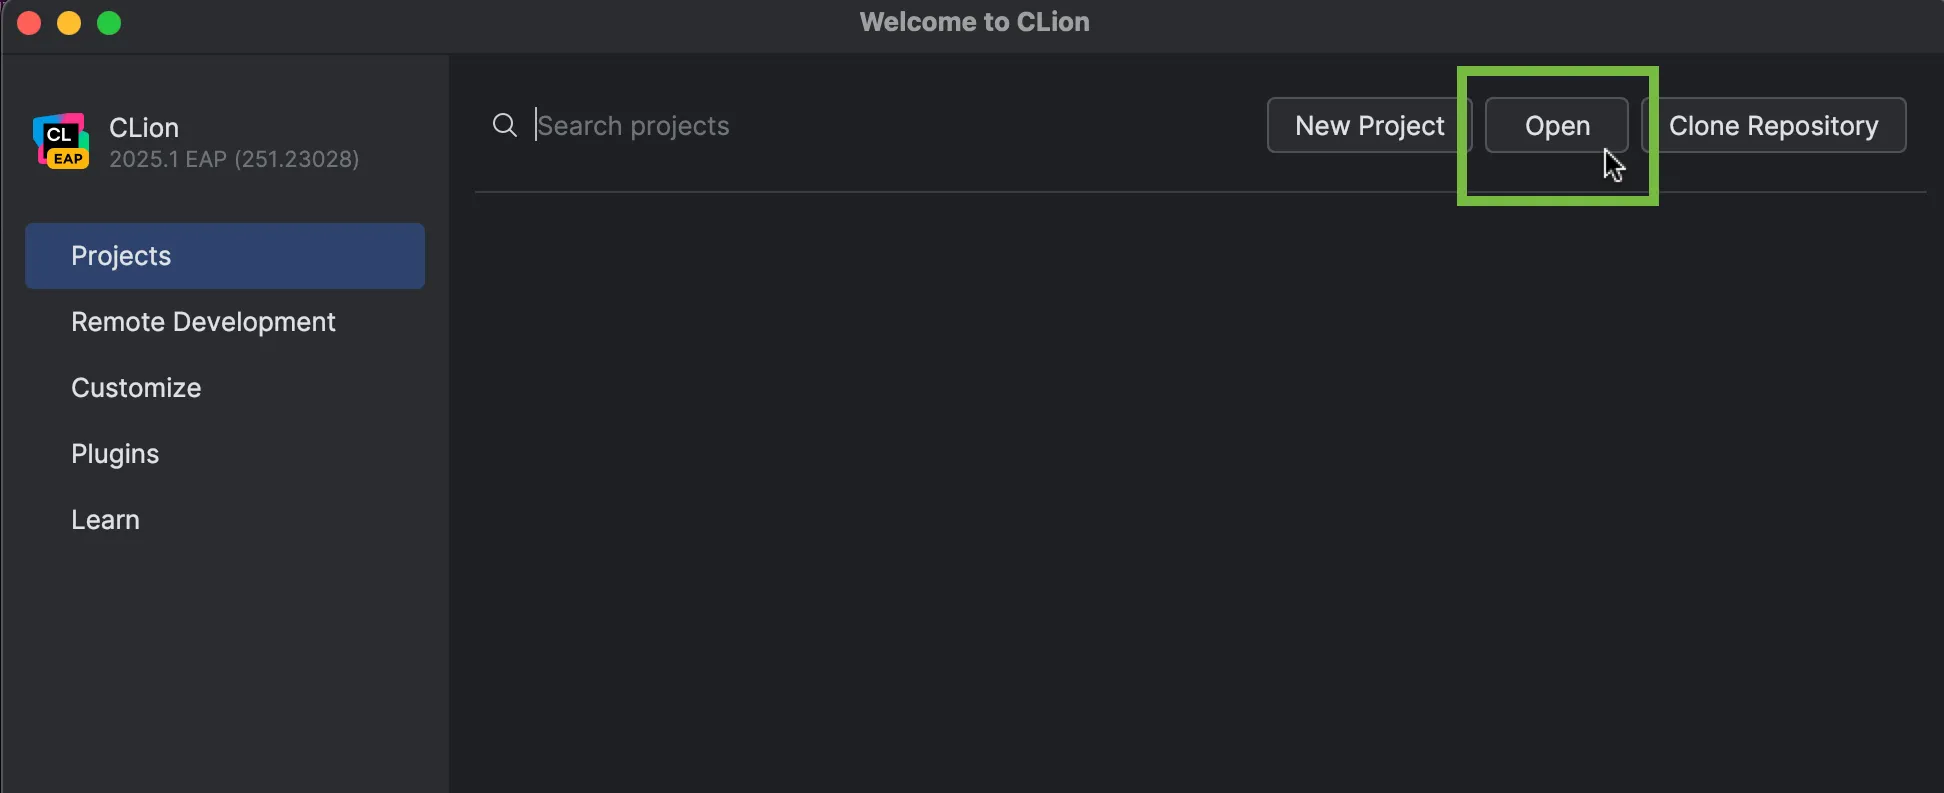
- Run CLion.
- Select
Openfrom the welcome screen.
- Navigate to the default ESP-IDF directory on your computer. For the purposes of this tutorial, this is
/Users/username/esp/esp-idf. Then, go to theexamplessubdirectory and select a project to build.
In this tutorial, we’ll be using led_strip_simple_encoder. It’s located in examples/peripherals/rmt. This application generates an LED rainbow chase on the board. Although it’s intended to be used with an LED strip, it also works with a single LED board like the one used here. The LED will simply flash different colors in a predetermined sequence.
- Click
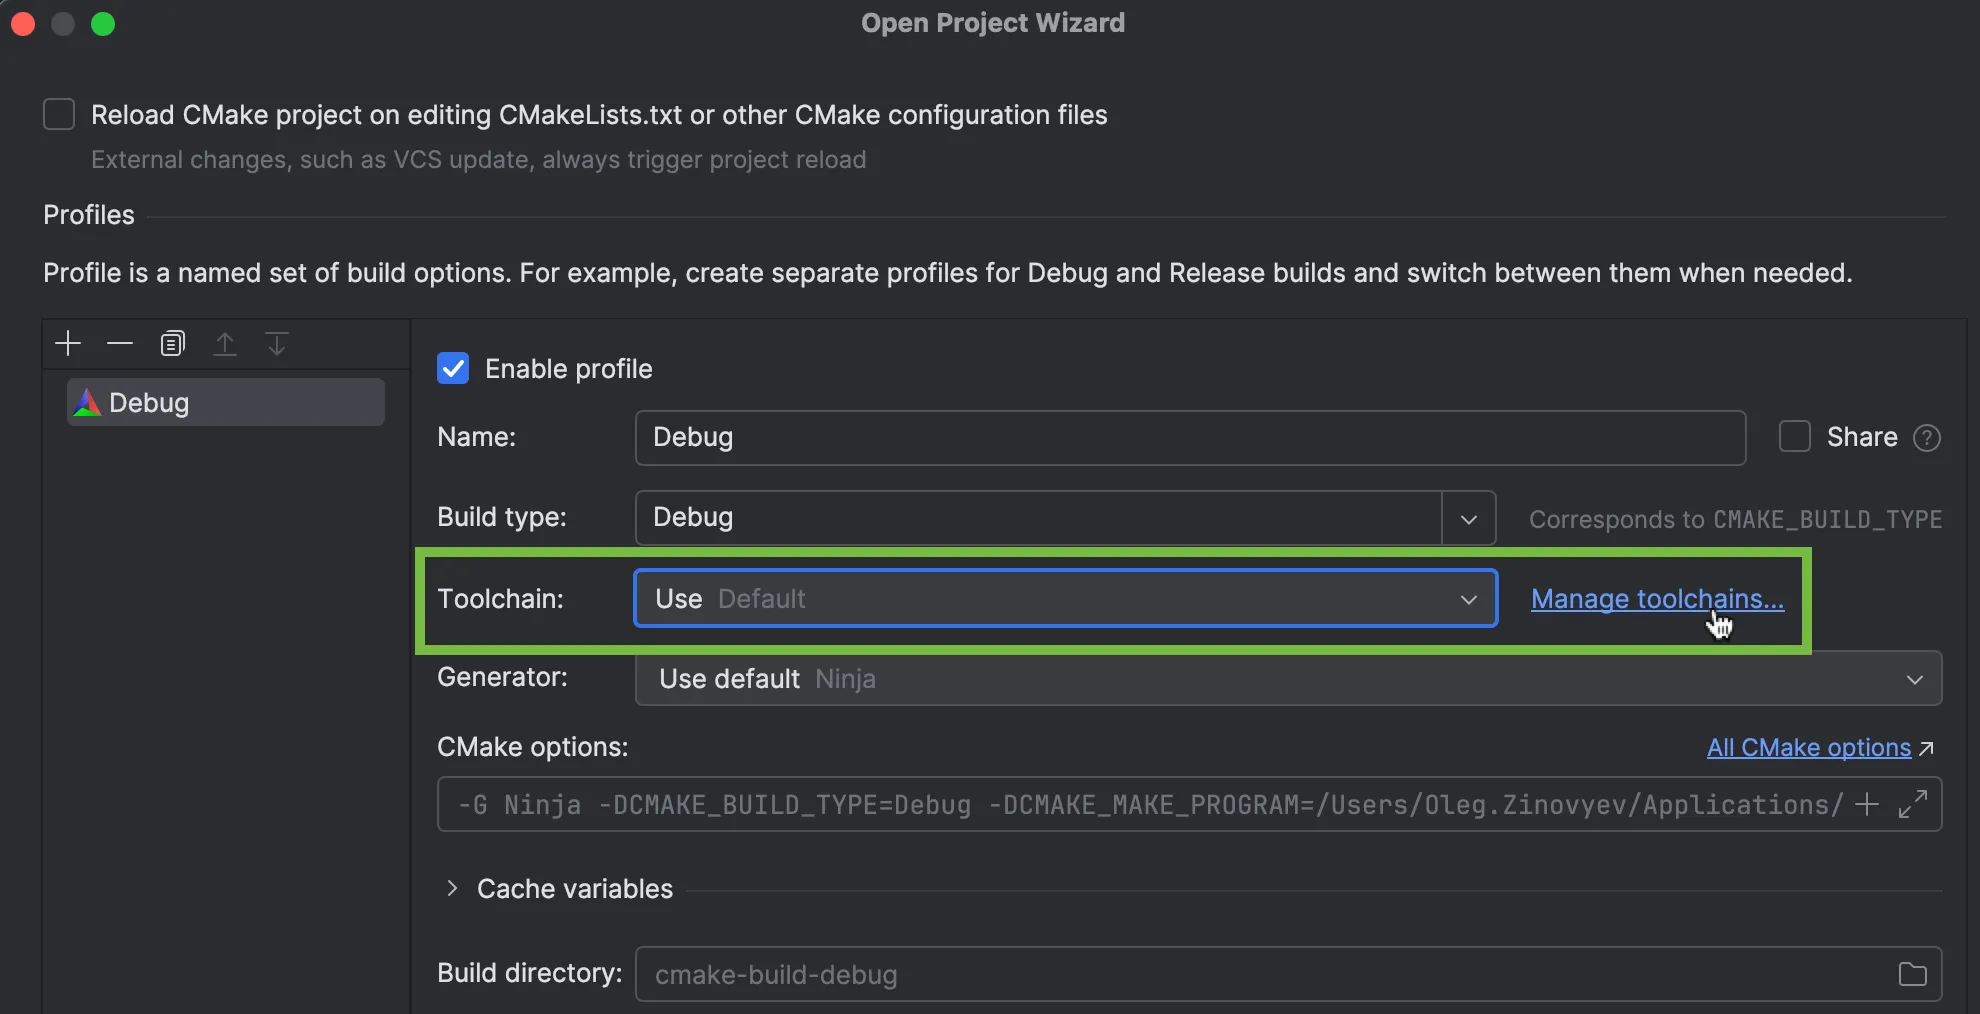
Trust Project. TheOpen Project Wizardwill then open. - Click
Manage toolchains....
Click
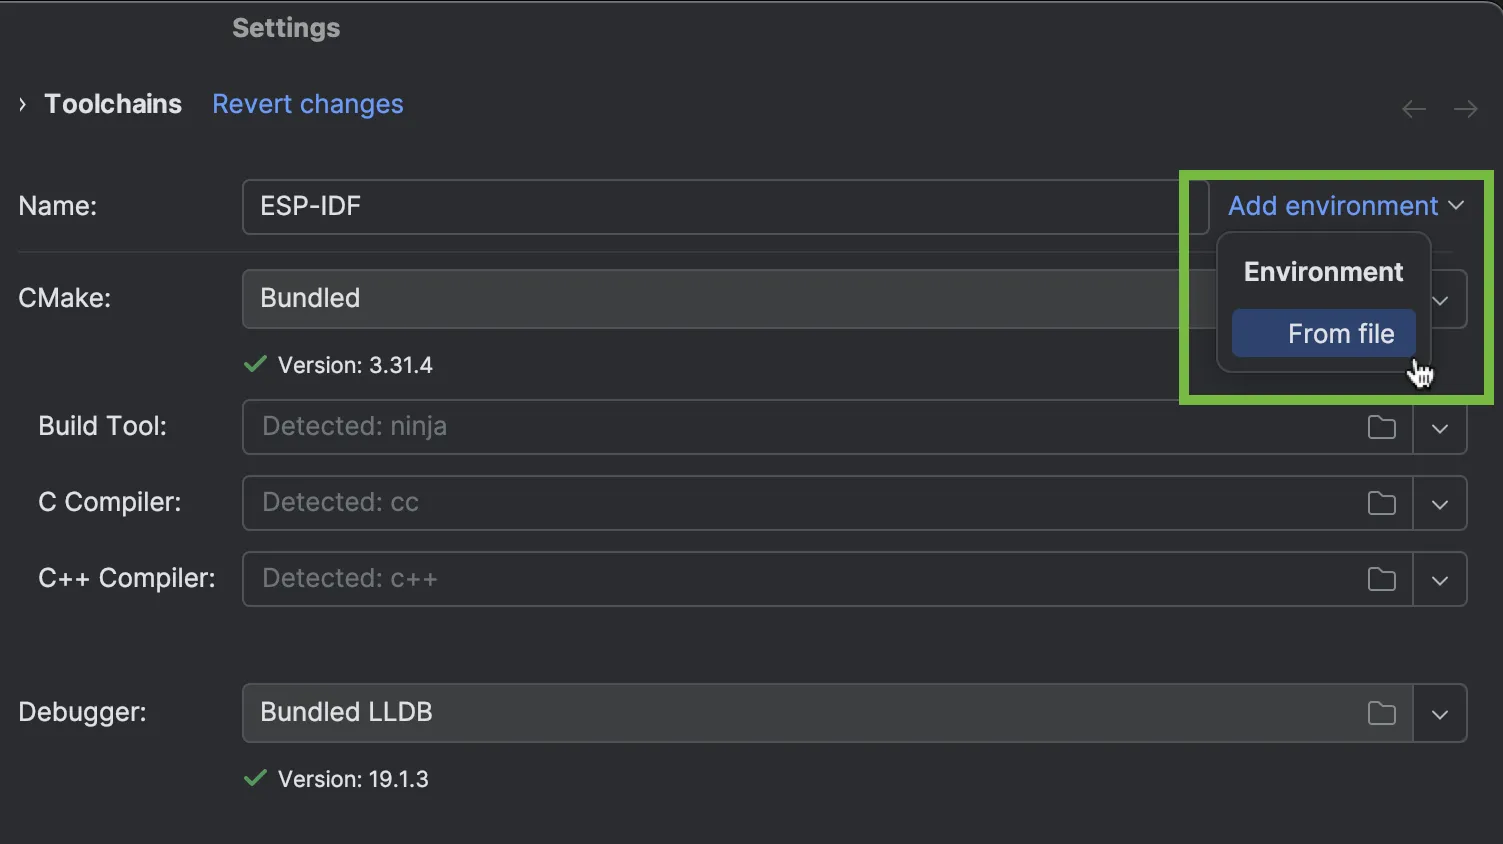
+, and selectSystem(for Windows, selectMinGWinstead) to create a new toolchain. You can name it anything you like.- Select
Add environment>From filein the new toolchain template.
- Click
Browse....
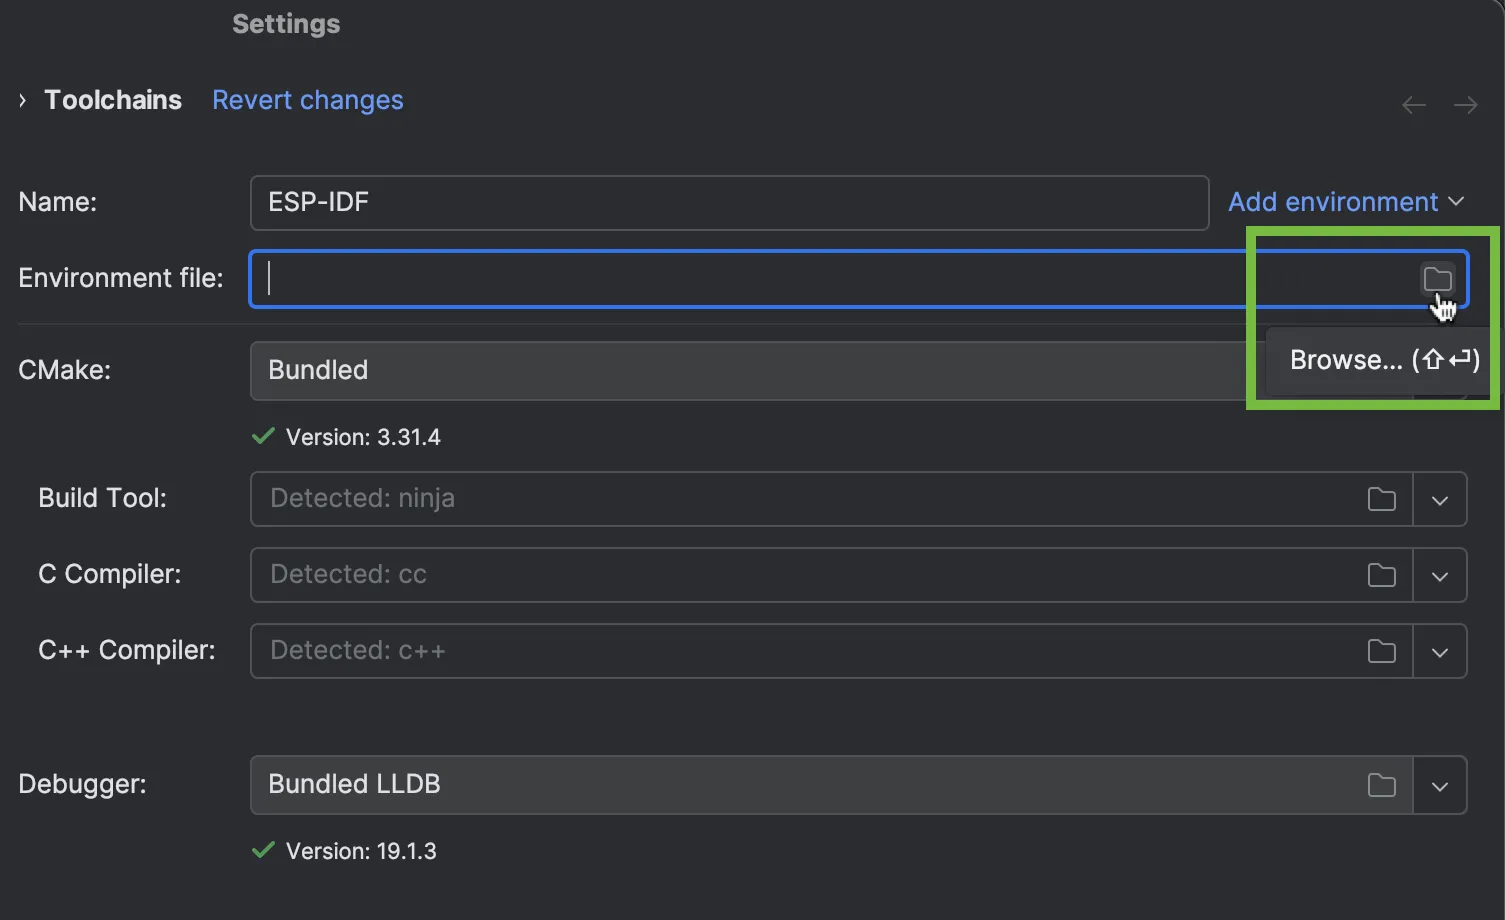
- Select the environment file on your computer. For macOS, you need the file called
export.sh(on Windows, it’sexport.bat), which is located in the default ESP-IDF directory. - Click
Apply
- Select
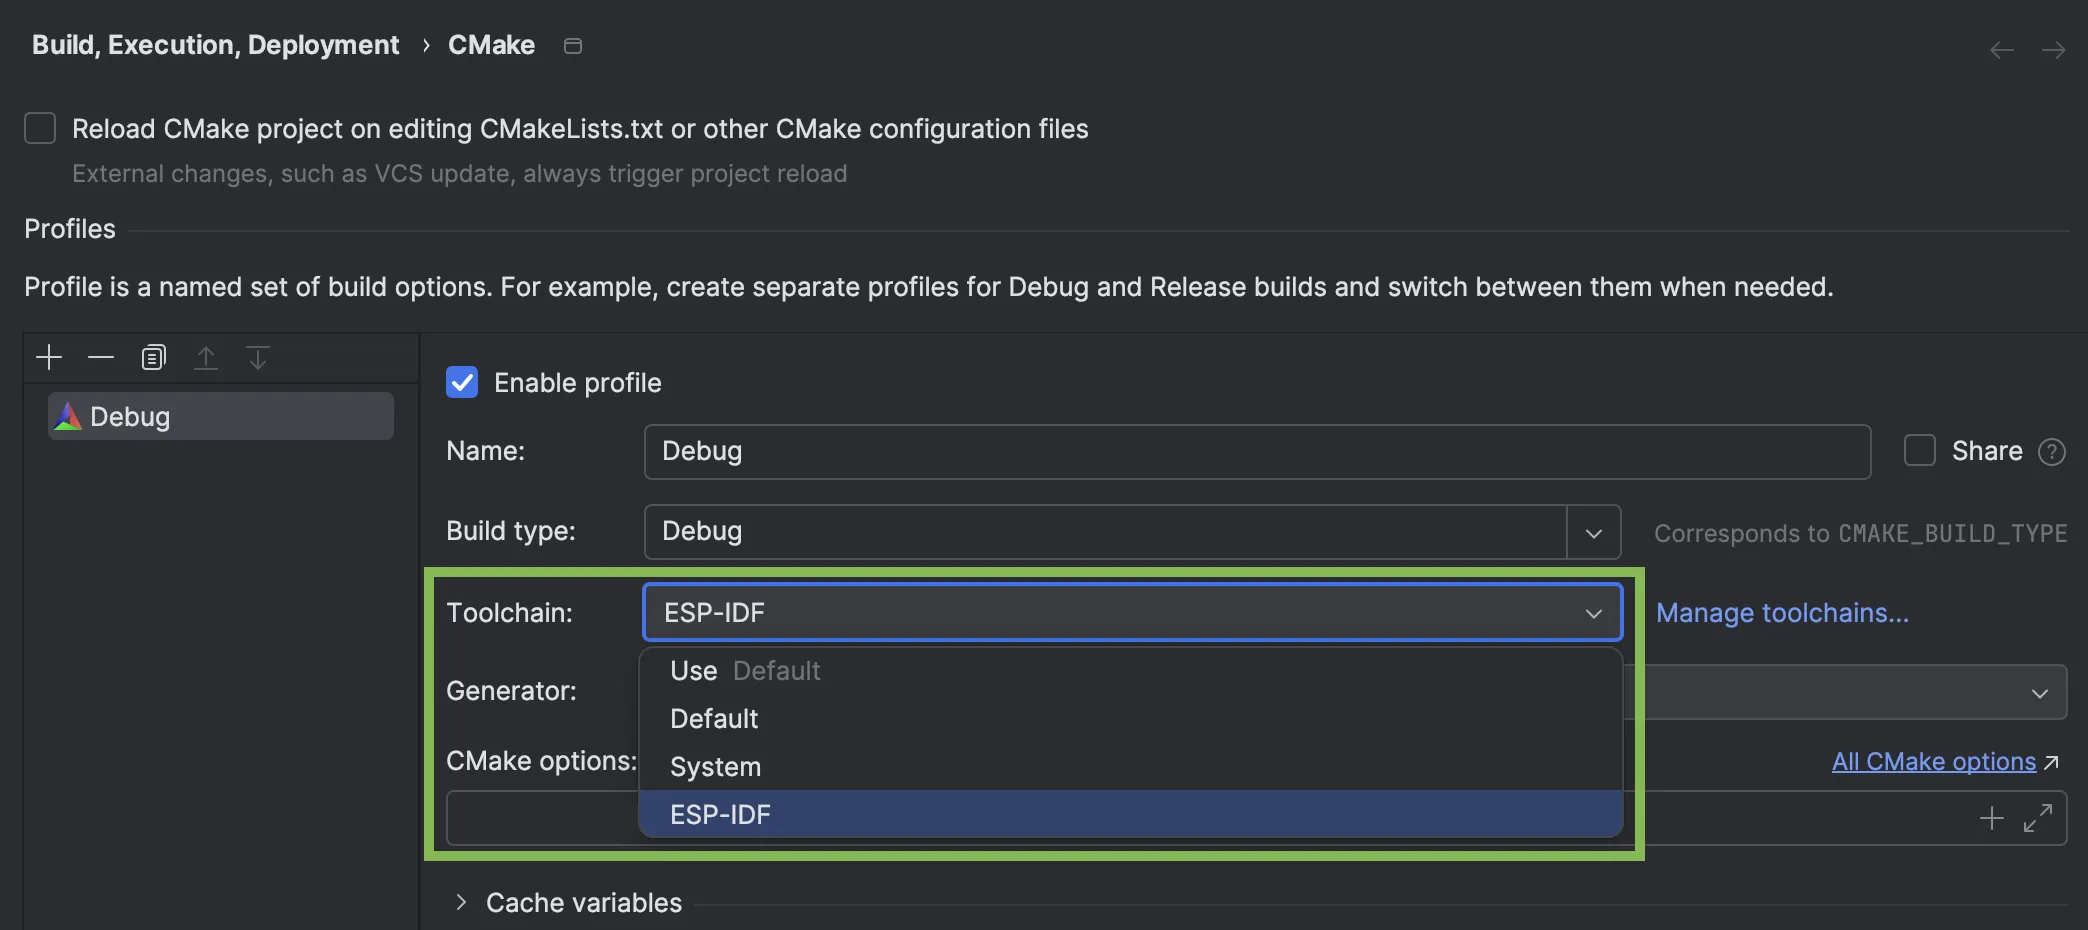
Go to
Settings>Build, Execution, Deployment>CMake.- In the default
Debugprofile settings, select the recently created toolchain, which in our case isESP-IDF.
- In the
CMake optionsfield, enter-DIDF_TARGET=esp32s3(because an ESP32-S3-based board is used). - In the
Build directoryfield, enterbuild. - Click
OK.
- In the default
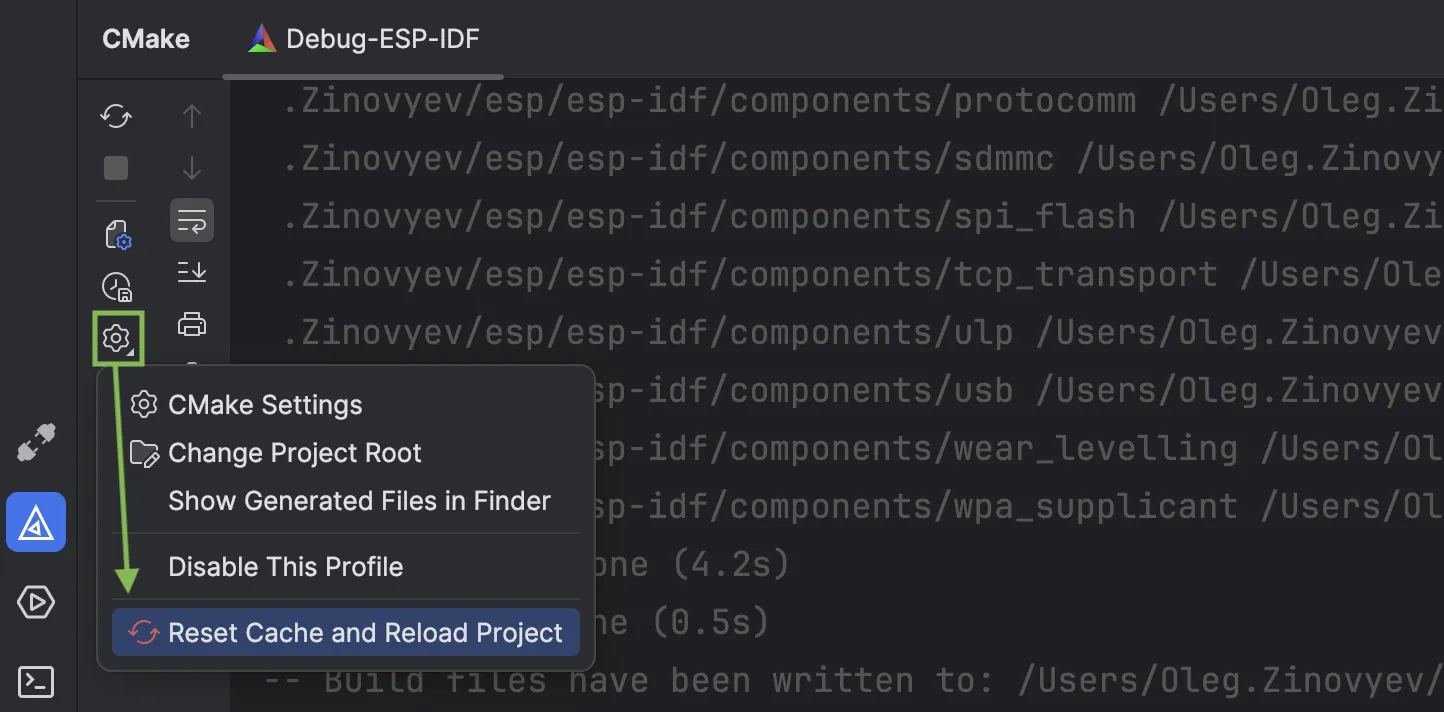
Your project will then start to load. If the process fails, click Reset Cache and Reload Project in the CMake tool window settings.
If the project is loaded successfully, you’ll see [Finished] at the end of the CMake log. Your application is ready to be built and flashed to the board.
Building the application and flashing the board#
Make sure your board is connected to your computer via the UART port.
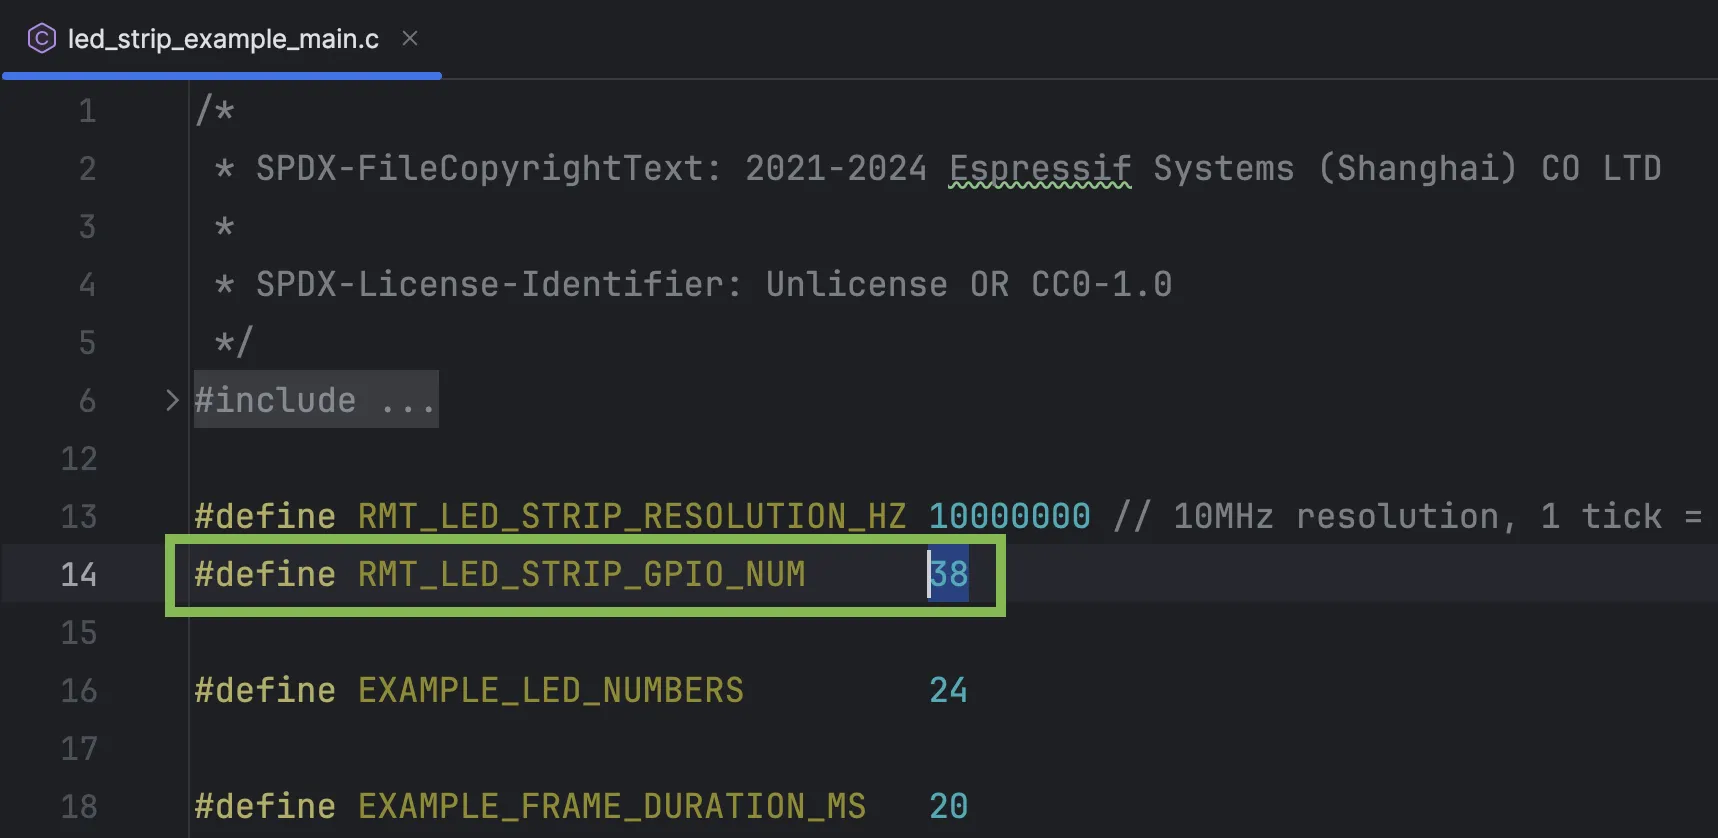
If you’re using the same application example, make sure that the GPIO LED number is correctly specified in the source code:
- In CLion’s
Projecttool window, locate the main directory in your project directory and open theled_strip_example_main.cfile. - In the
#define RMT_LED_STRIP_GPIO_NUMline, change the default value to38or48, depending on your board hardware revision.
- In CLion’s
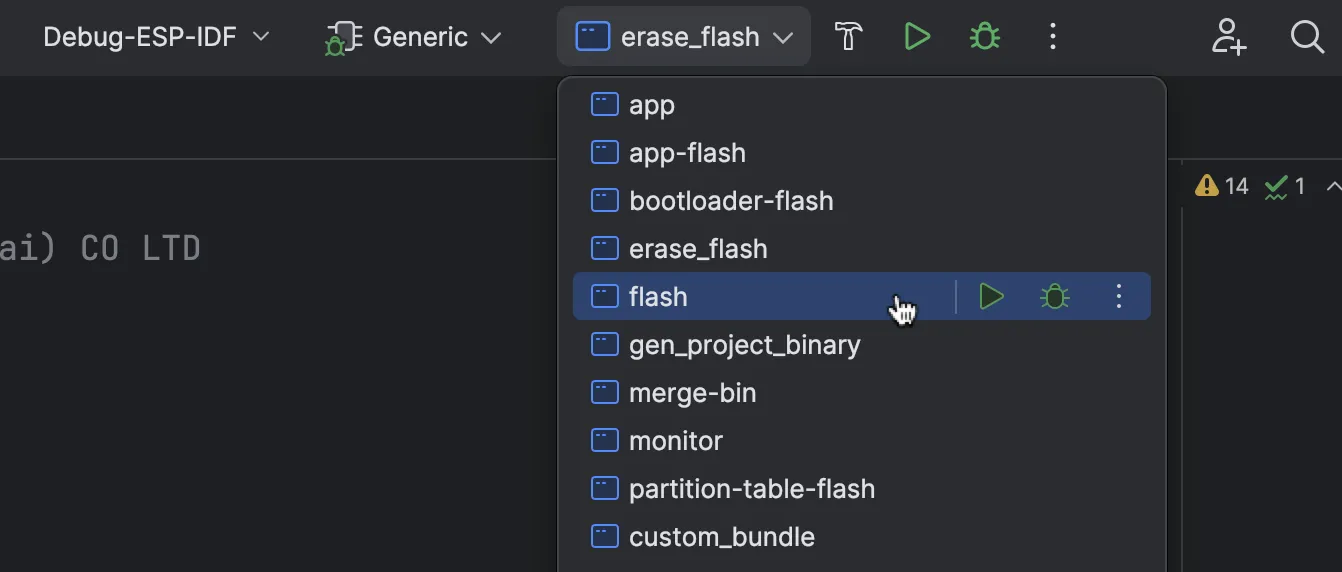
Click the
Run / Debug Configurationsdrop-down list on the main toolbar and select theflashconfiguration. This configuration allows you to build the project and then flash the board automatically.
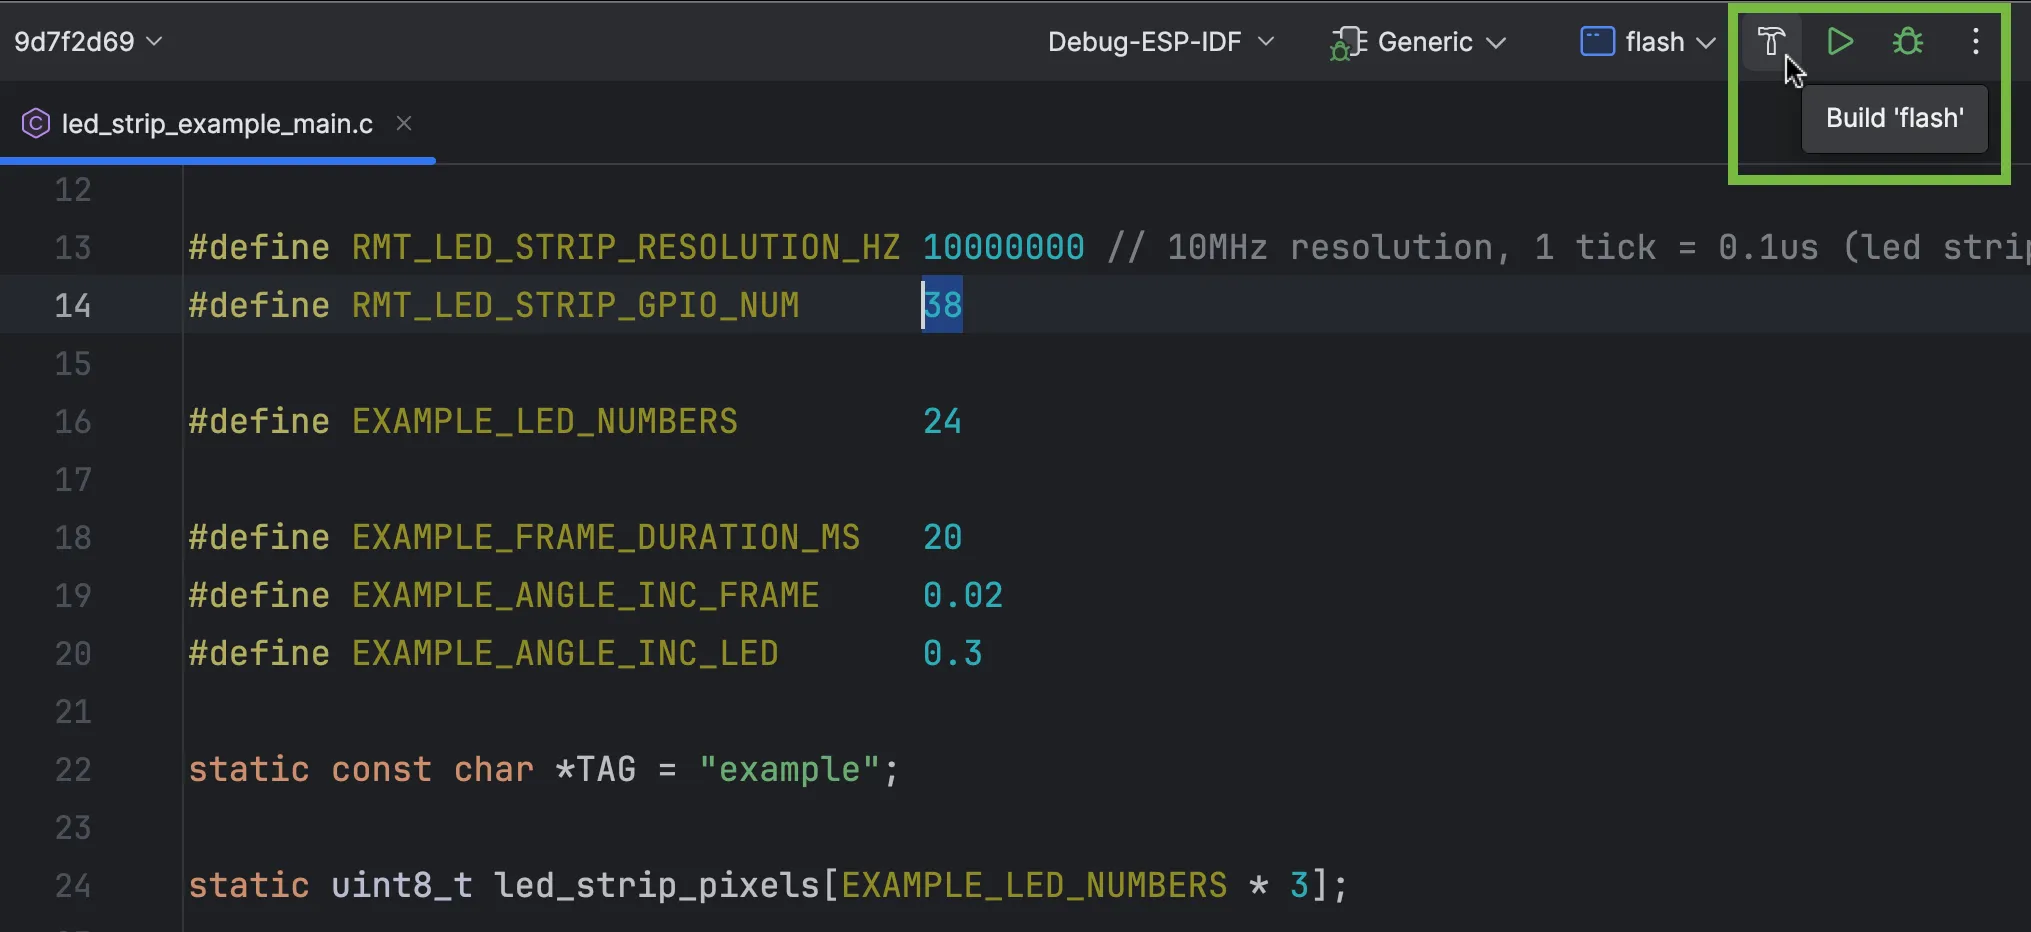
- Click the green
Buildicon on the main IDE toolbar.
In the Messages tool window, you can see data on the building and flashing processes.
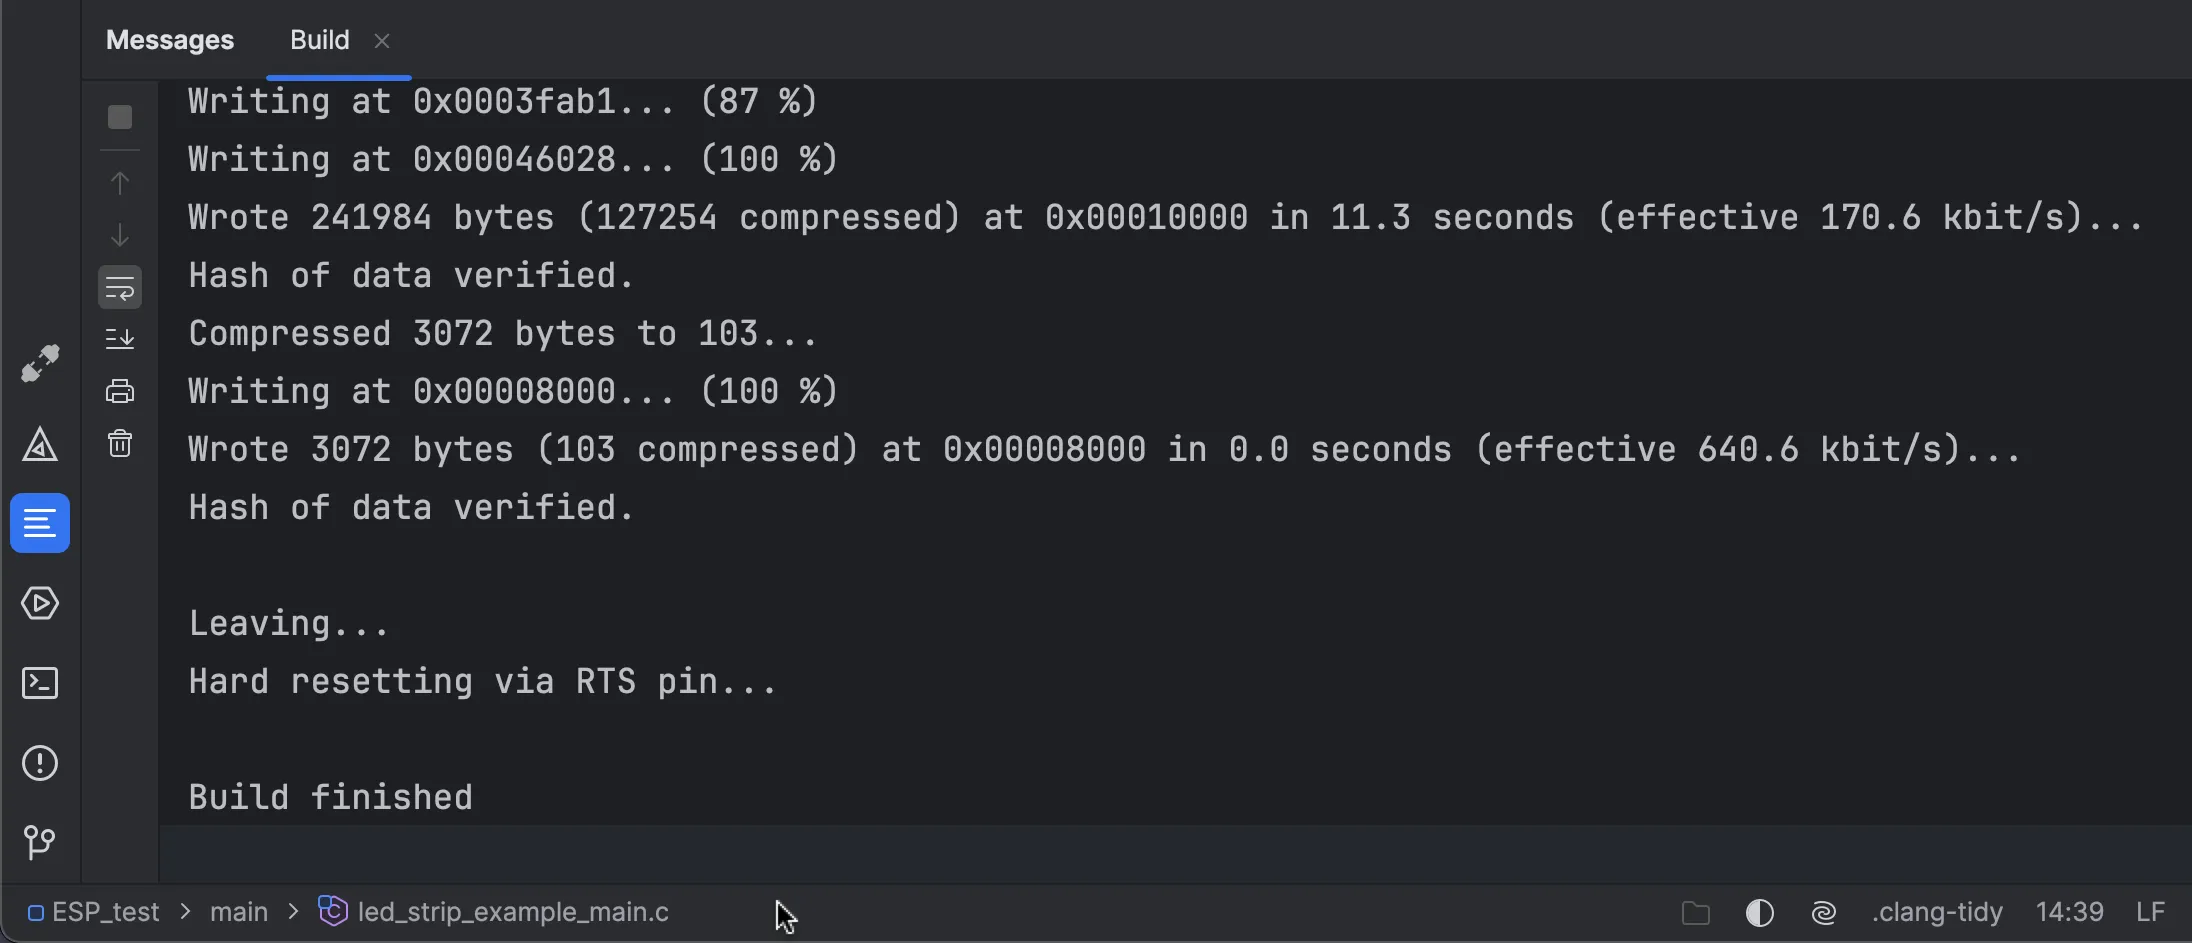
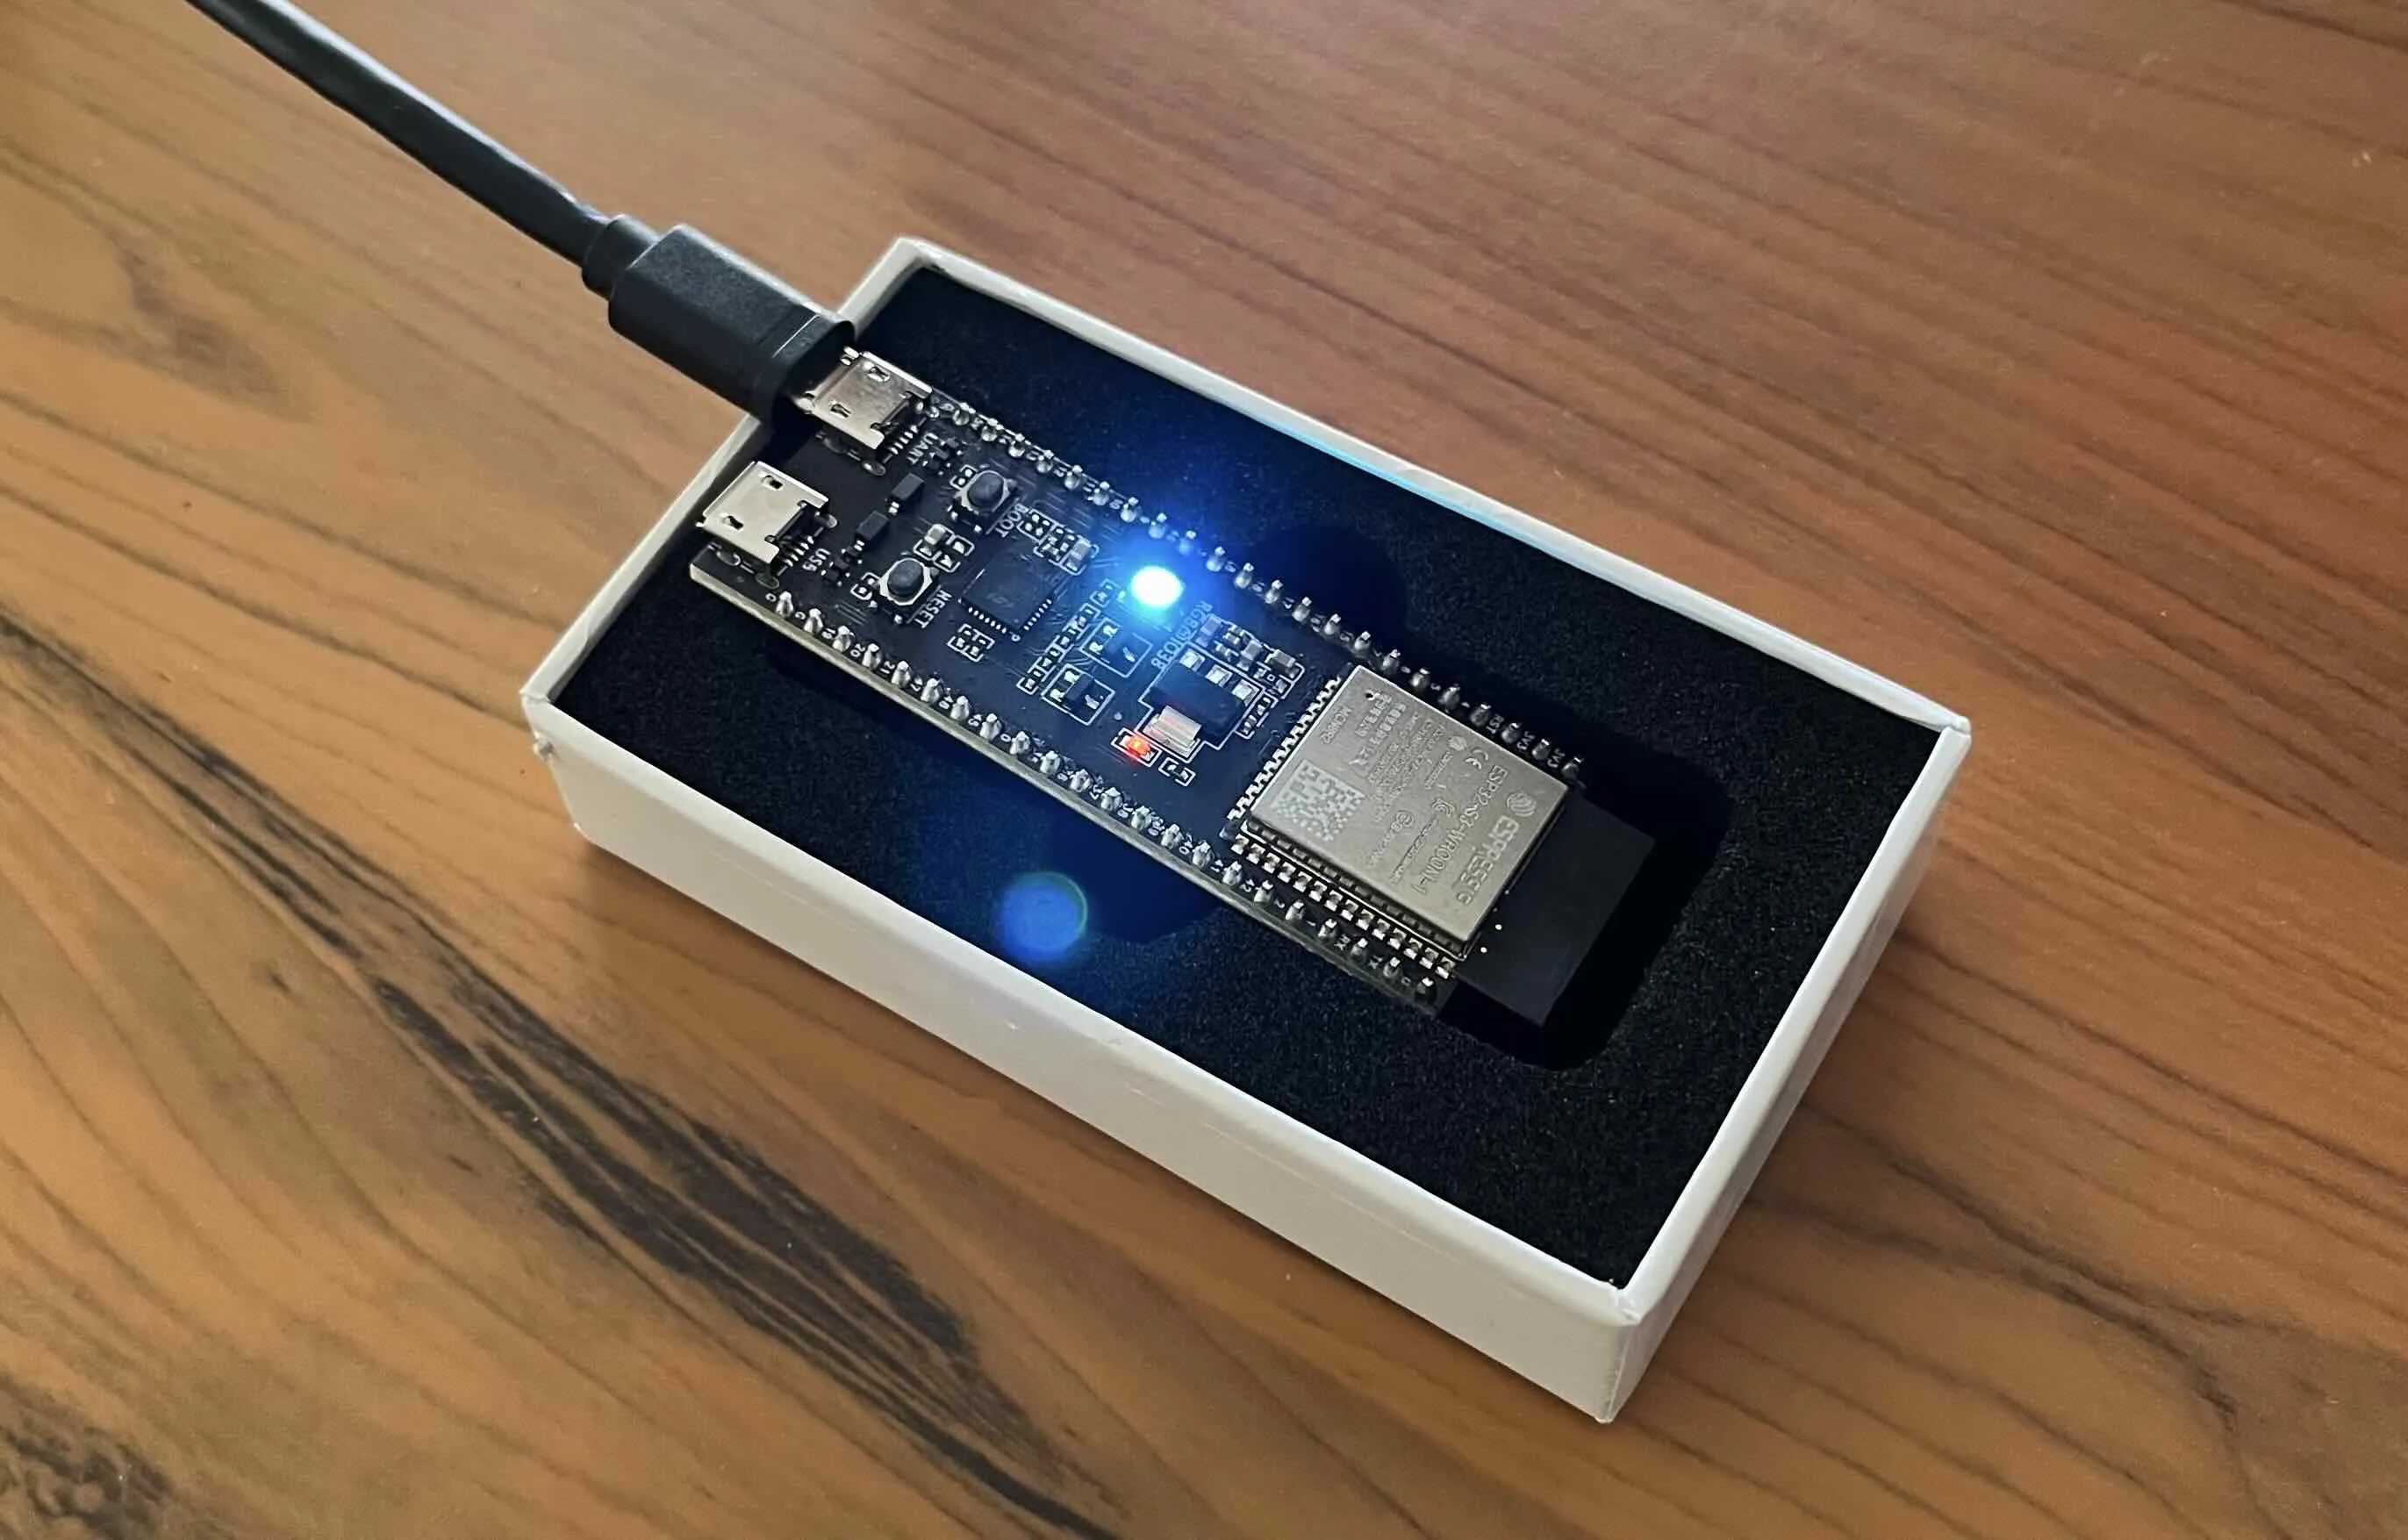
After the build, the board will blink according to the configured rainbow-chase pattern.
To change the chasing speed, update the EXAMPLE_ANGLE_INC_FRAME value in led_strip_example_main.c. To change the density of colors, update EXAMPLE_ANGLE_INC_LED in the same file.
Running the IDF monitor#
- Copy the path to your environment file from the toolchain settings. For this tutorial, it’s
/Users/Oleg.Zinovyev/esp/esp-idf/export.sh. - Go to
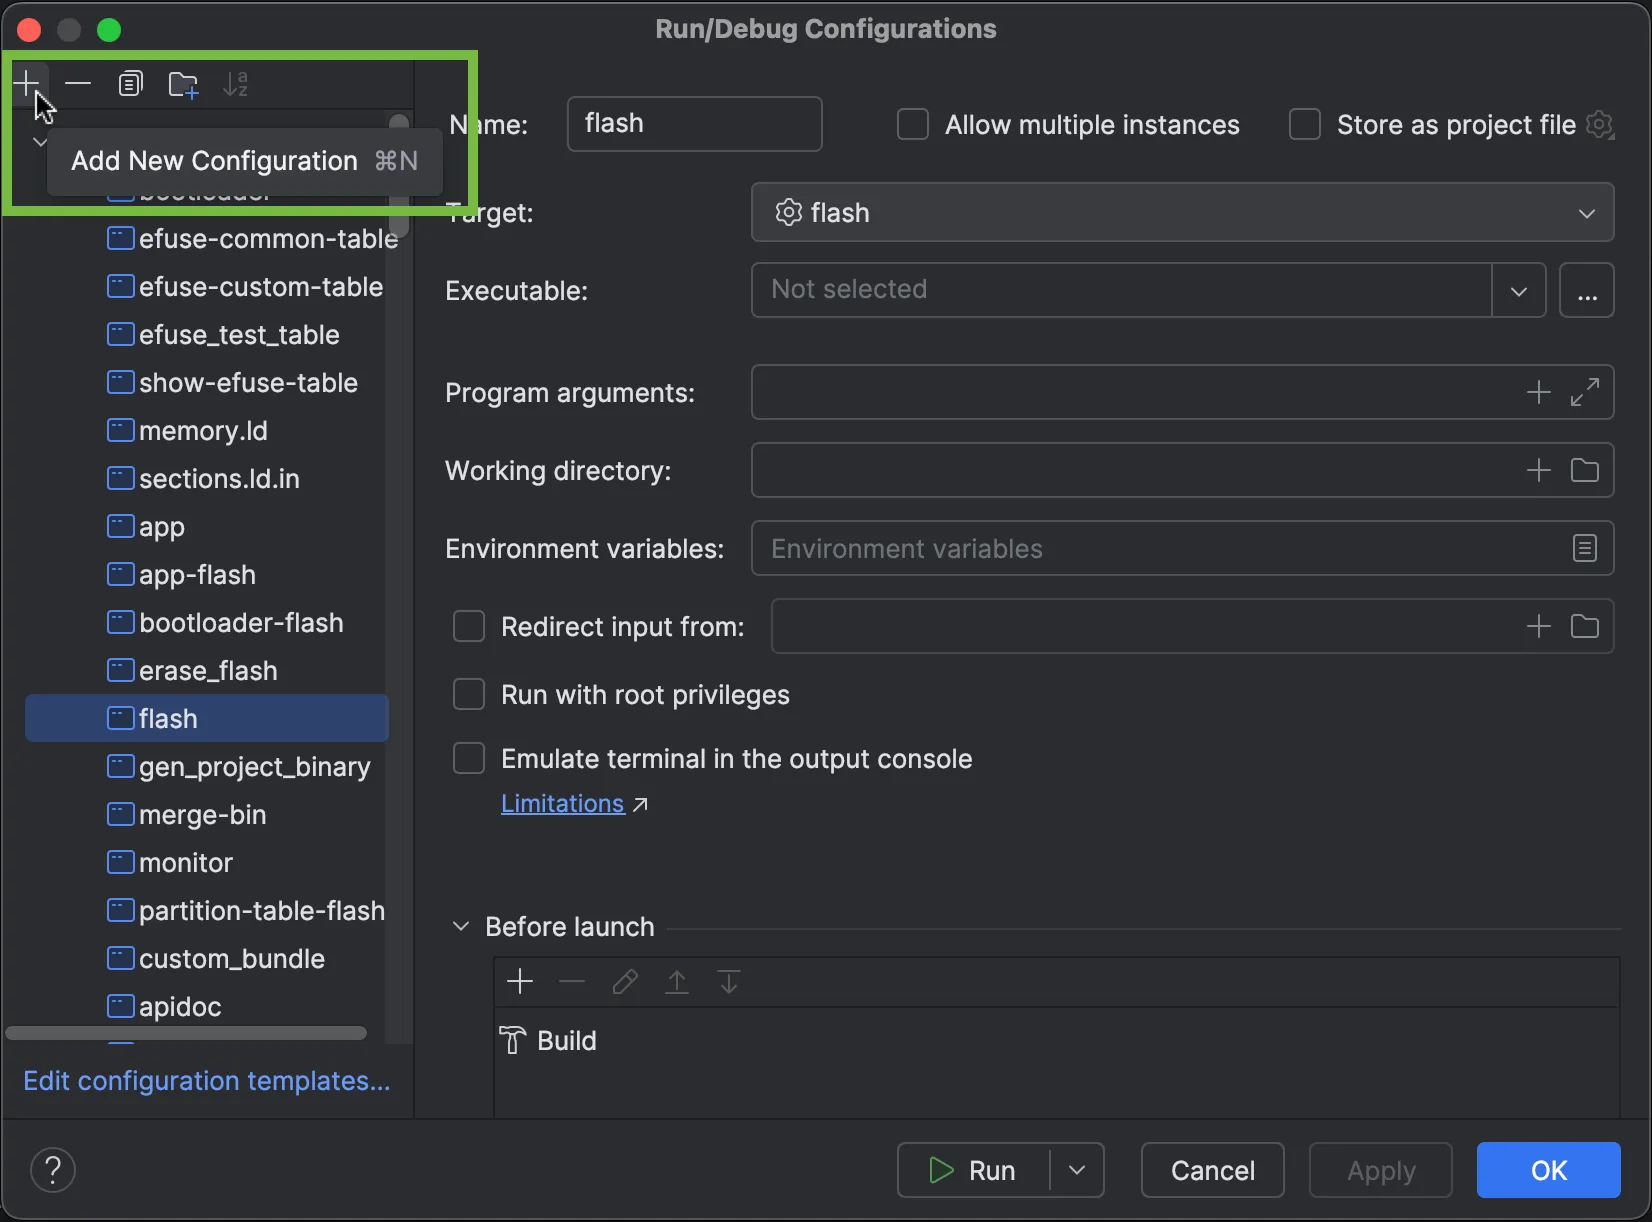
Run | Edit Configurationsand clickAdd New Configuration.
Select the
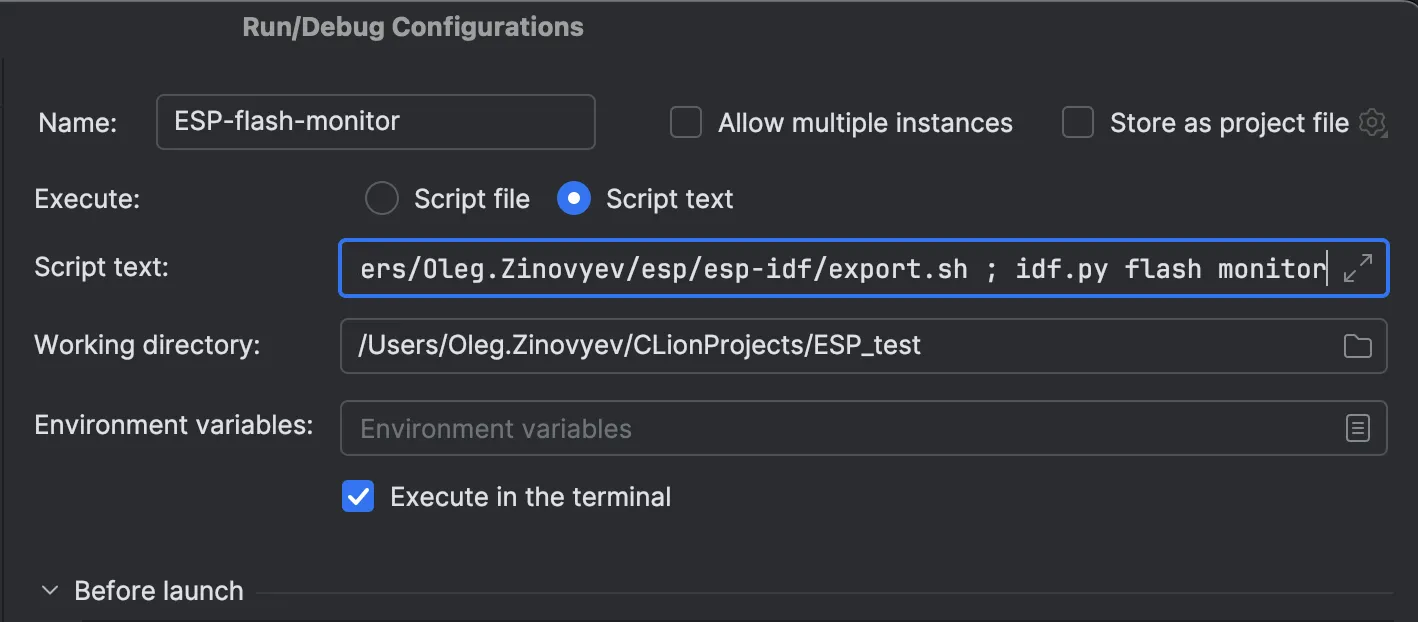
Shell Scripttemplate. In this new configuration dialog:- Enter a name of your choice.
- Select
Script textnext toExecute. - Enter the following text, including the path of the environment file you’ve just copied:
. /Users/Oleg.Zinovyev/esp/esp-idf/export.sh ; idf.py flash monitor.
- Leave the rest of the options as they are and click
OK.
Click the green
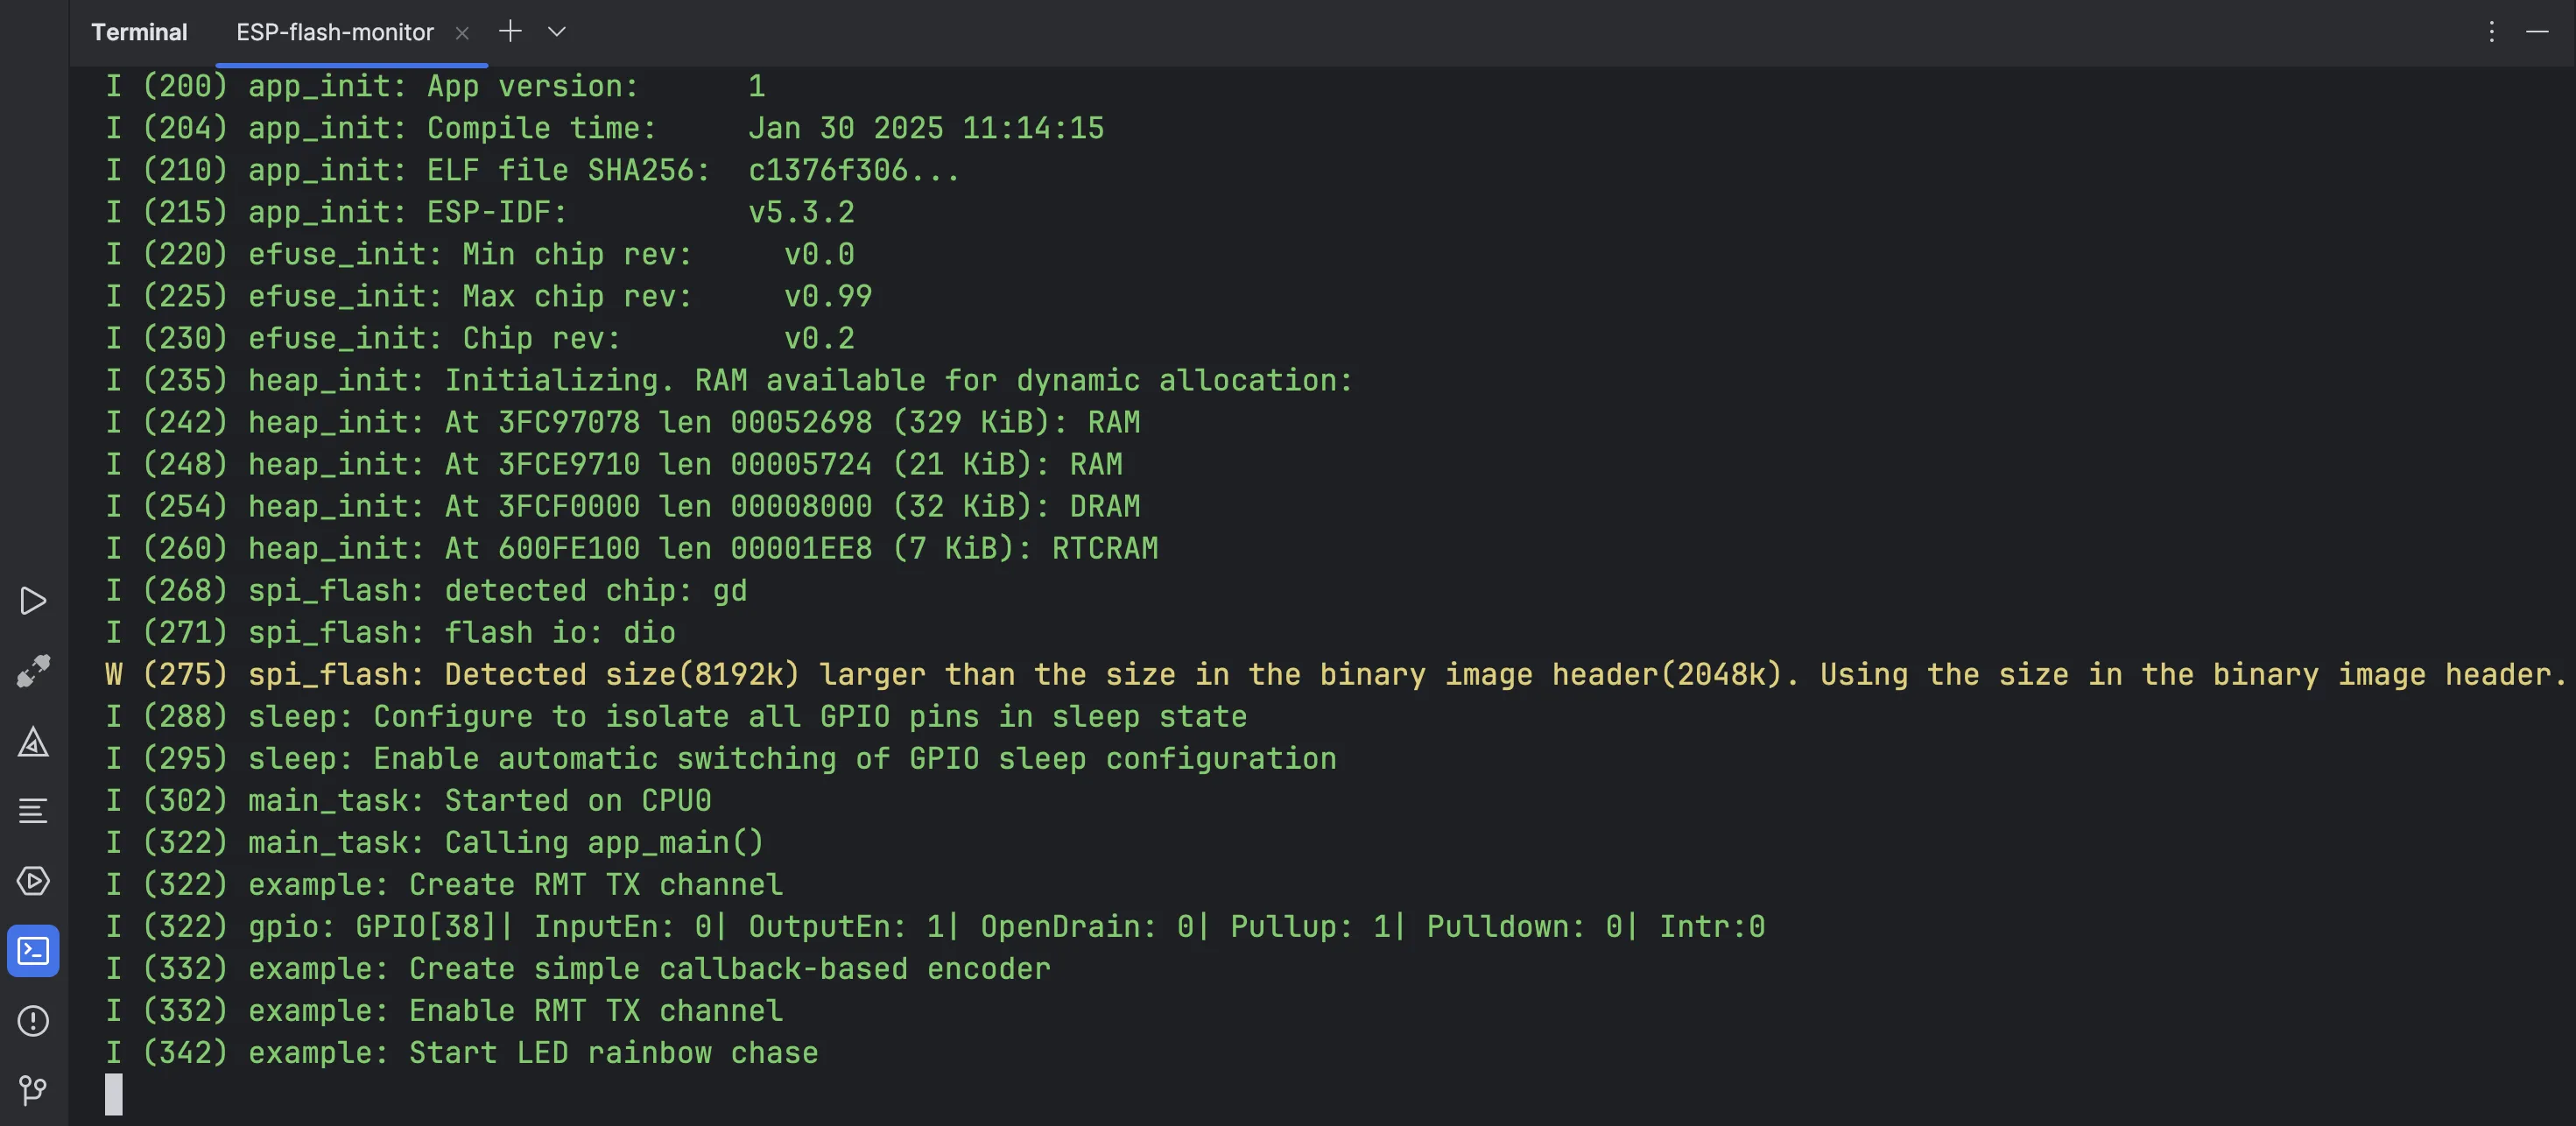
Runicon on the main toolbar.
You’ll then see the diagnostic data from the monitor displayed in the IDE’s terminal.
Working with the project configuration menu#
The project configuration menu is a GUI tool running in the terminal that allows you to configure your ESP-IDF project. It’s based on Kconfig and offers various low-level configuration options, including access to bootloader, serial flash, and security features.
The project configuration menu runs through the idf.py menuconfig command, so you need to configure a run configuration accordingly.
- Open the configuration you’ve created to run the serial monitor.
- Click
Copy Configuration.
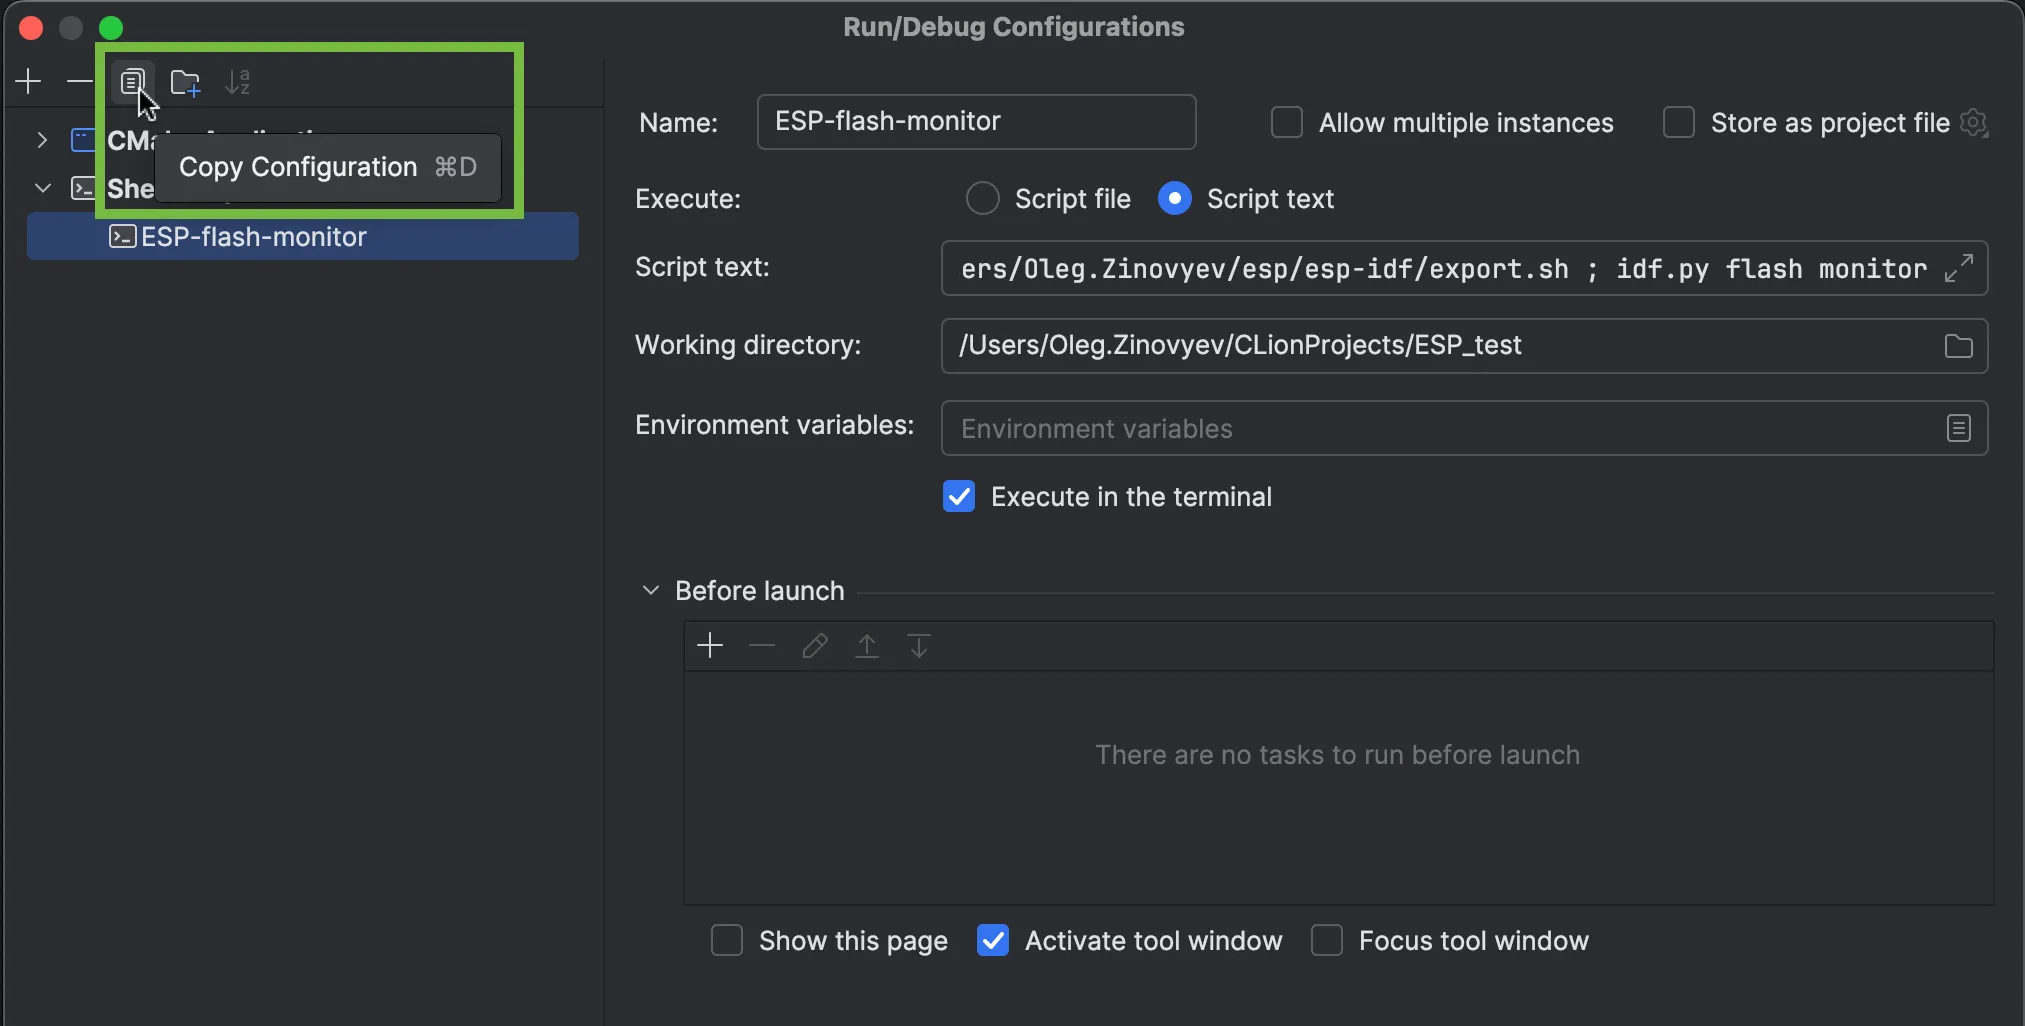
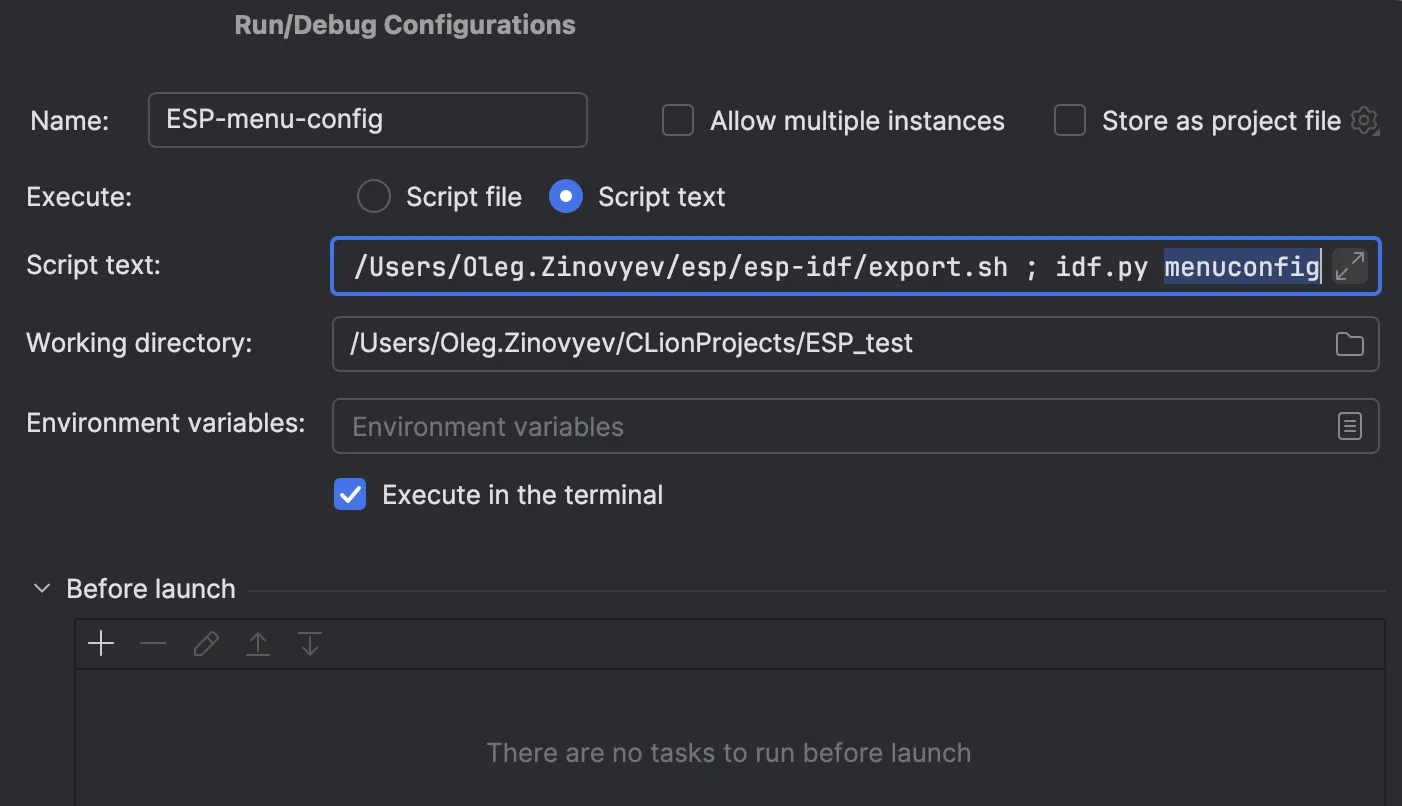
- Rename the copied configuration to reflect the new functionality, for example,
ESP-menu-config. - In the script text, replace
flash monitorwithmenuconfig.
- Click
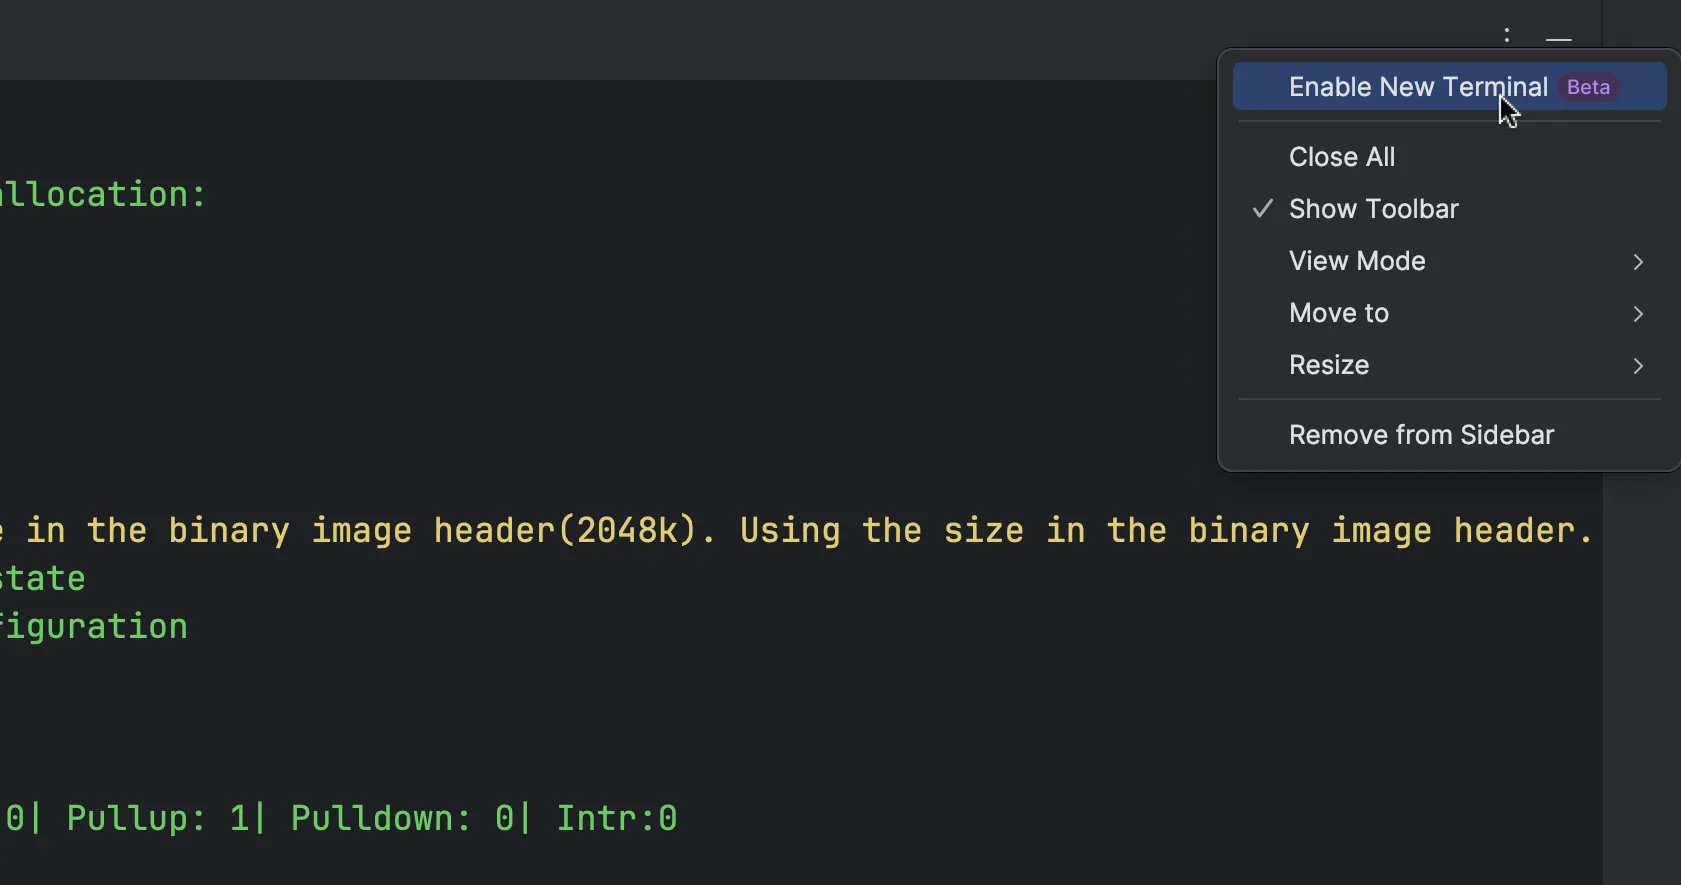
OK. - Make sure the IDE’s new terminal is disabled (unchecked), as the project configuration menu may not work properly with it.
- Click the green
Runicon on the main toolbar.
The project configuration menu will open in the IDE’s terminal.
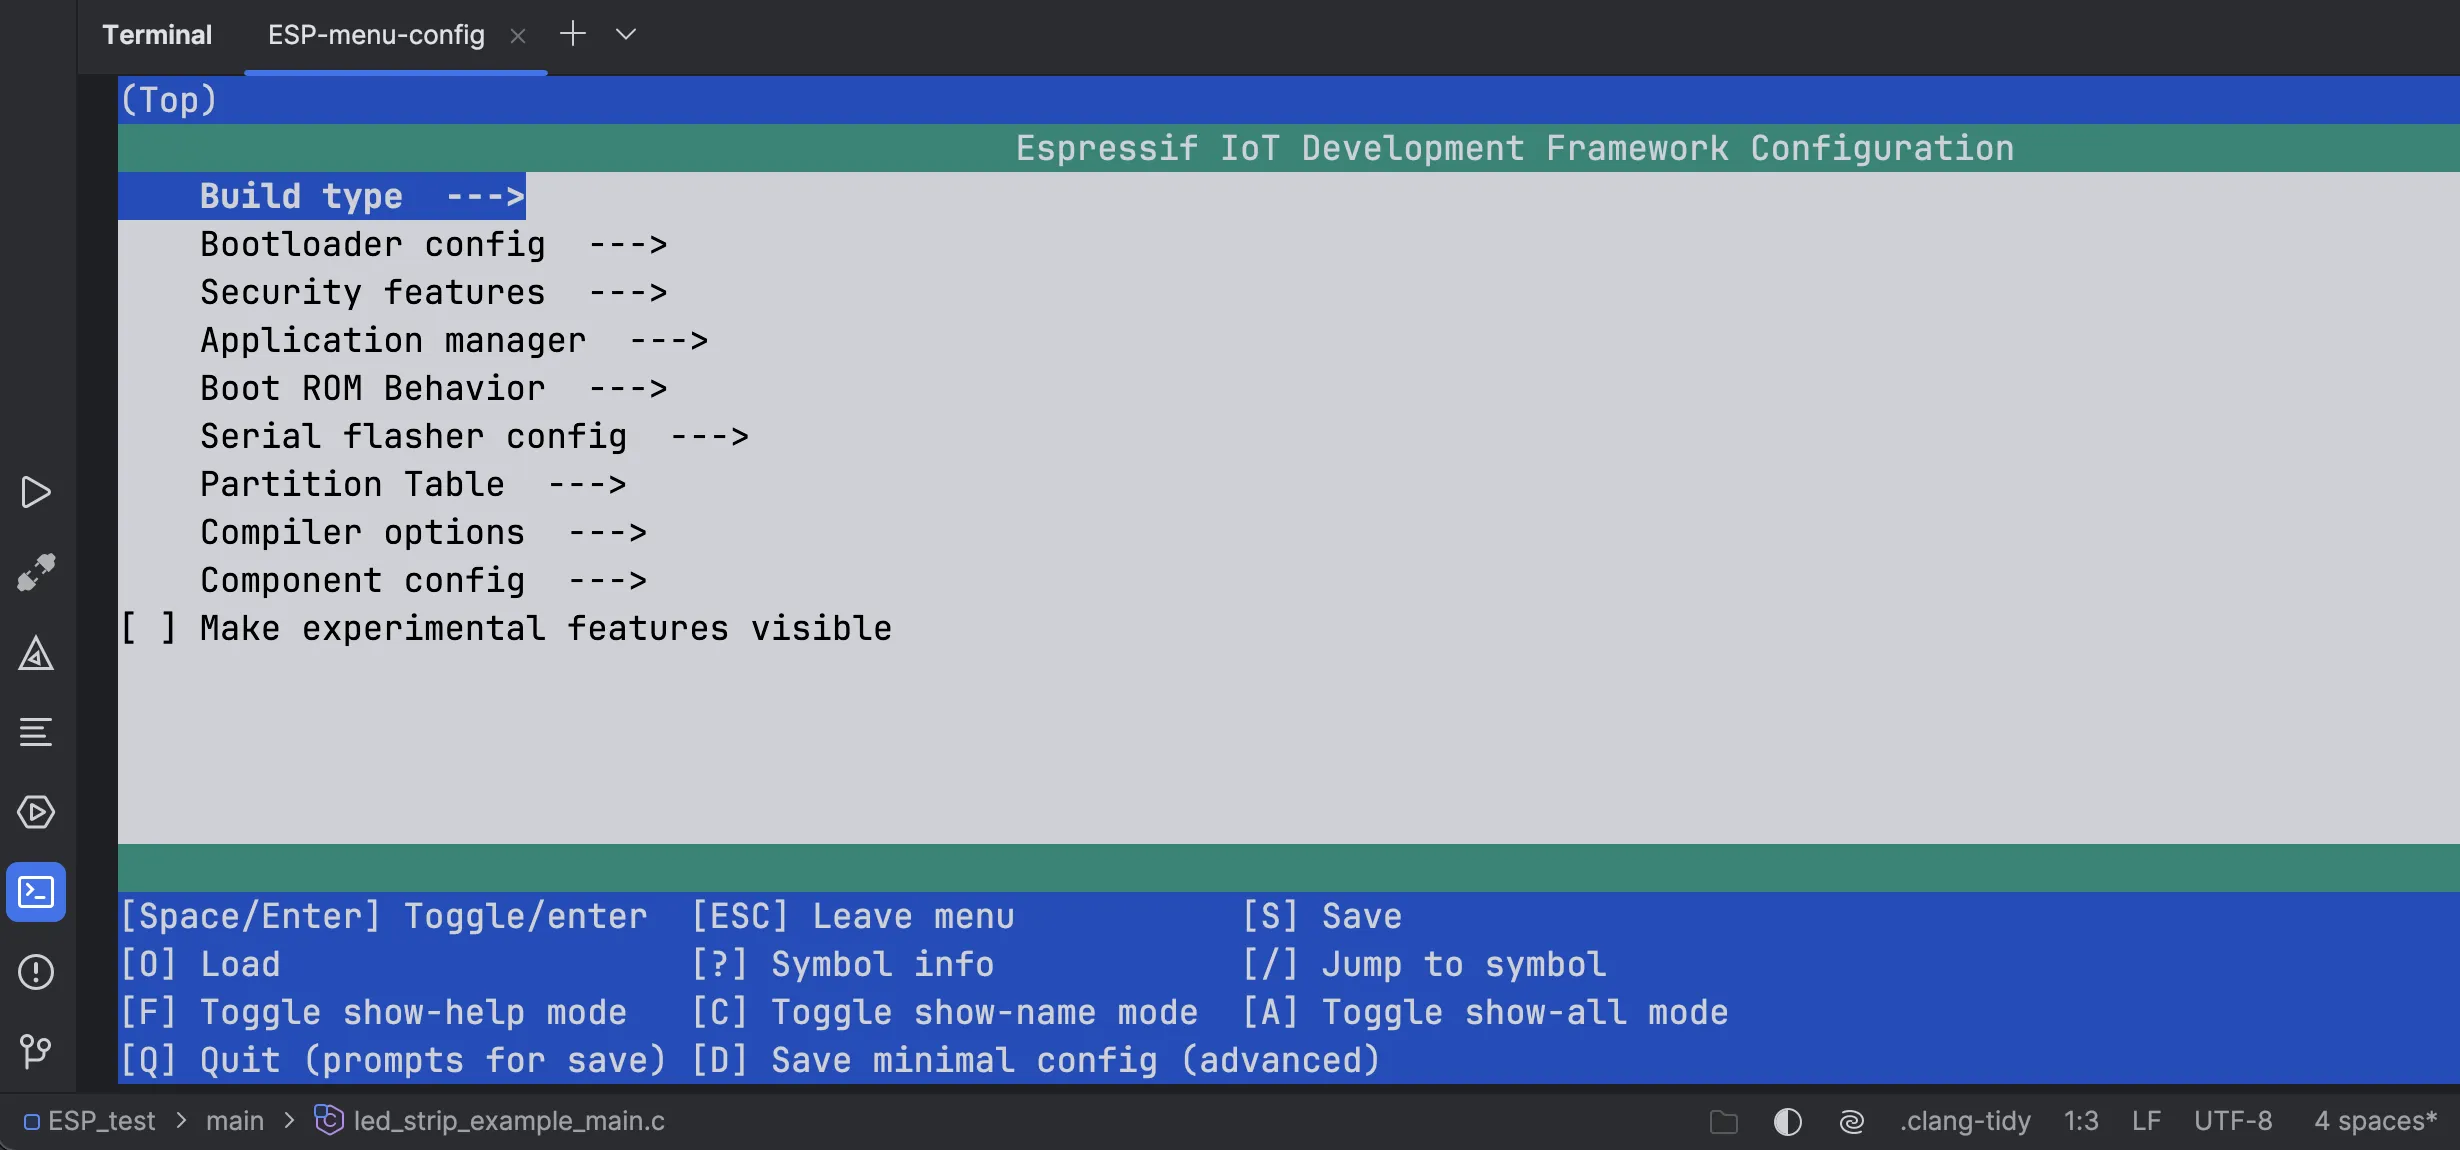
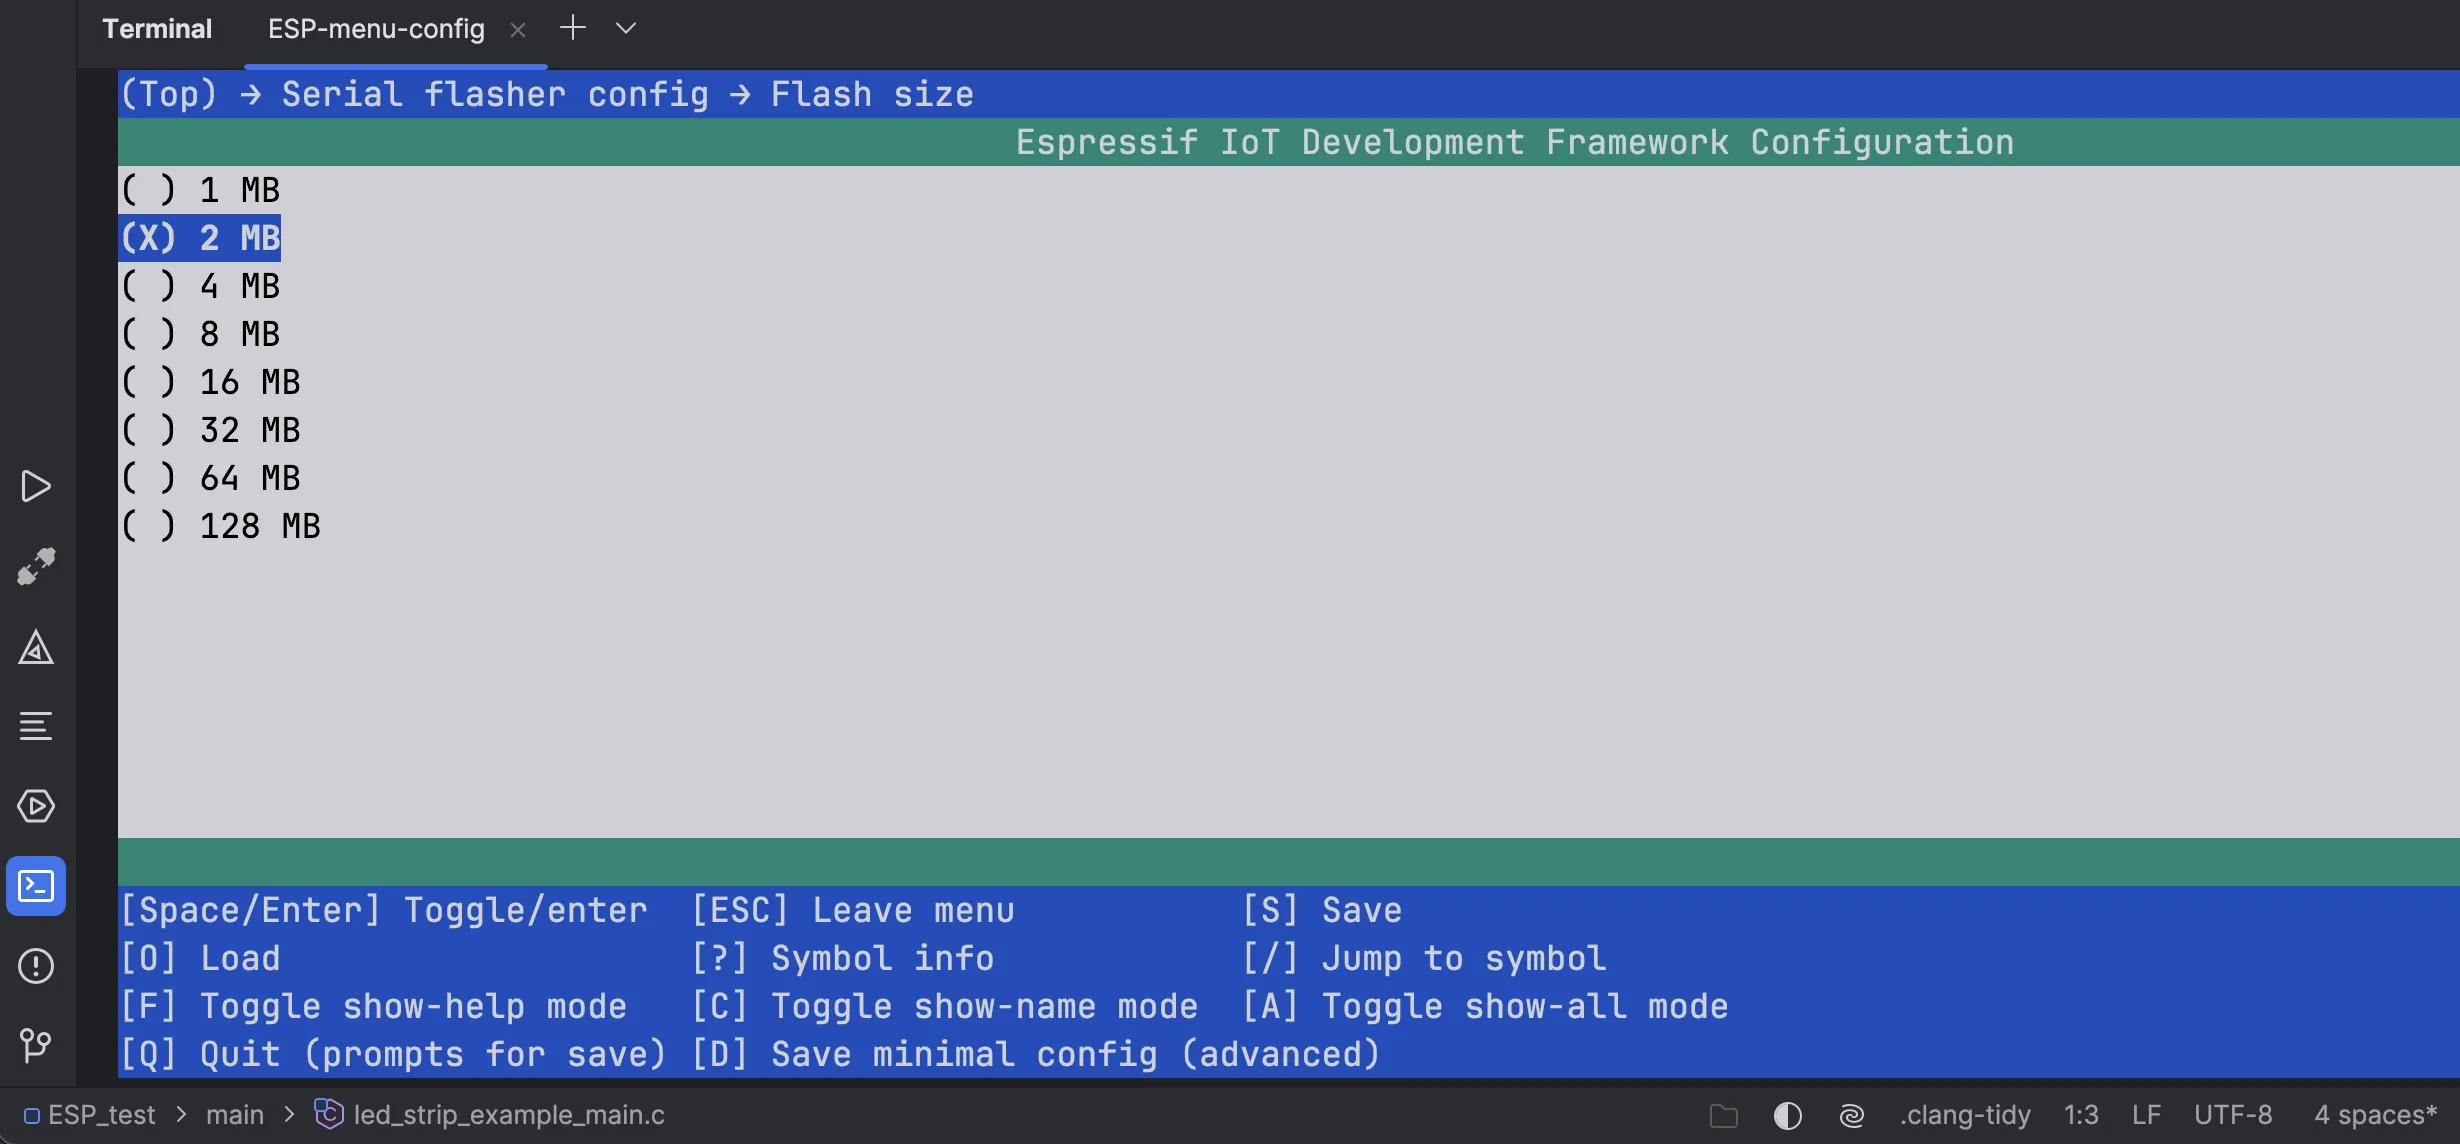
You can use the keyboard to navigate the menu and change the default parameters of your project, for example, the flash size.
Using the idf.py command in the terminal#
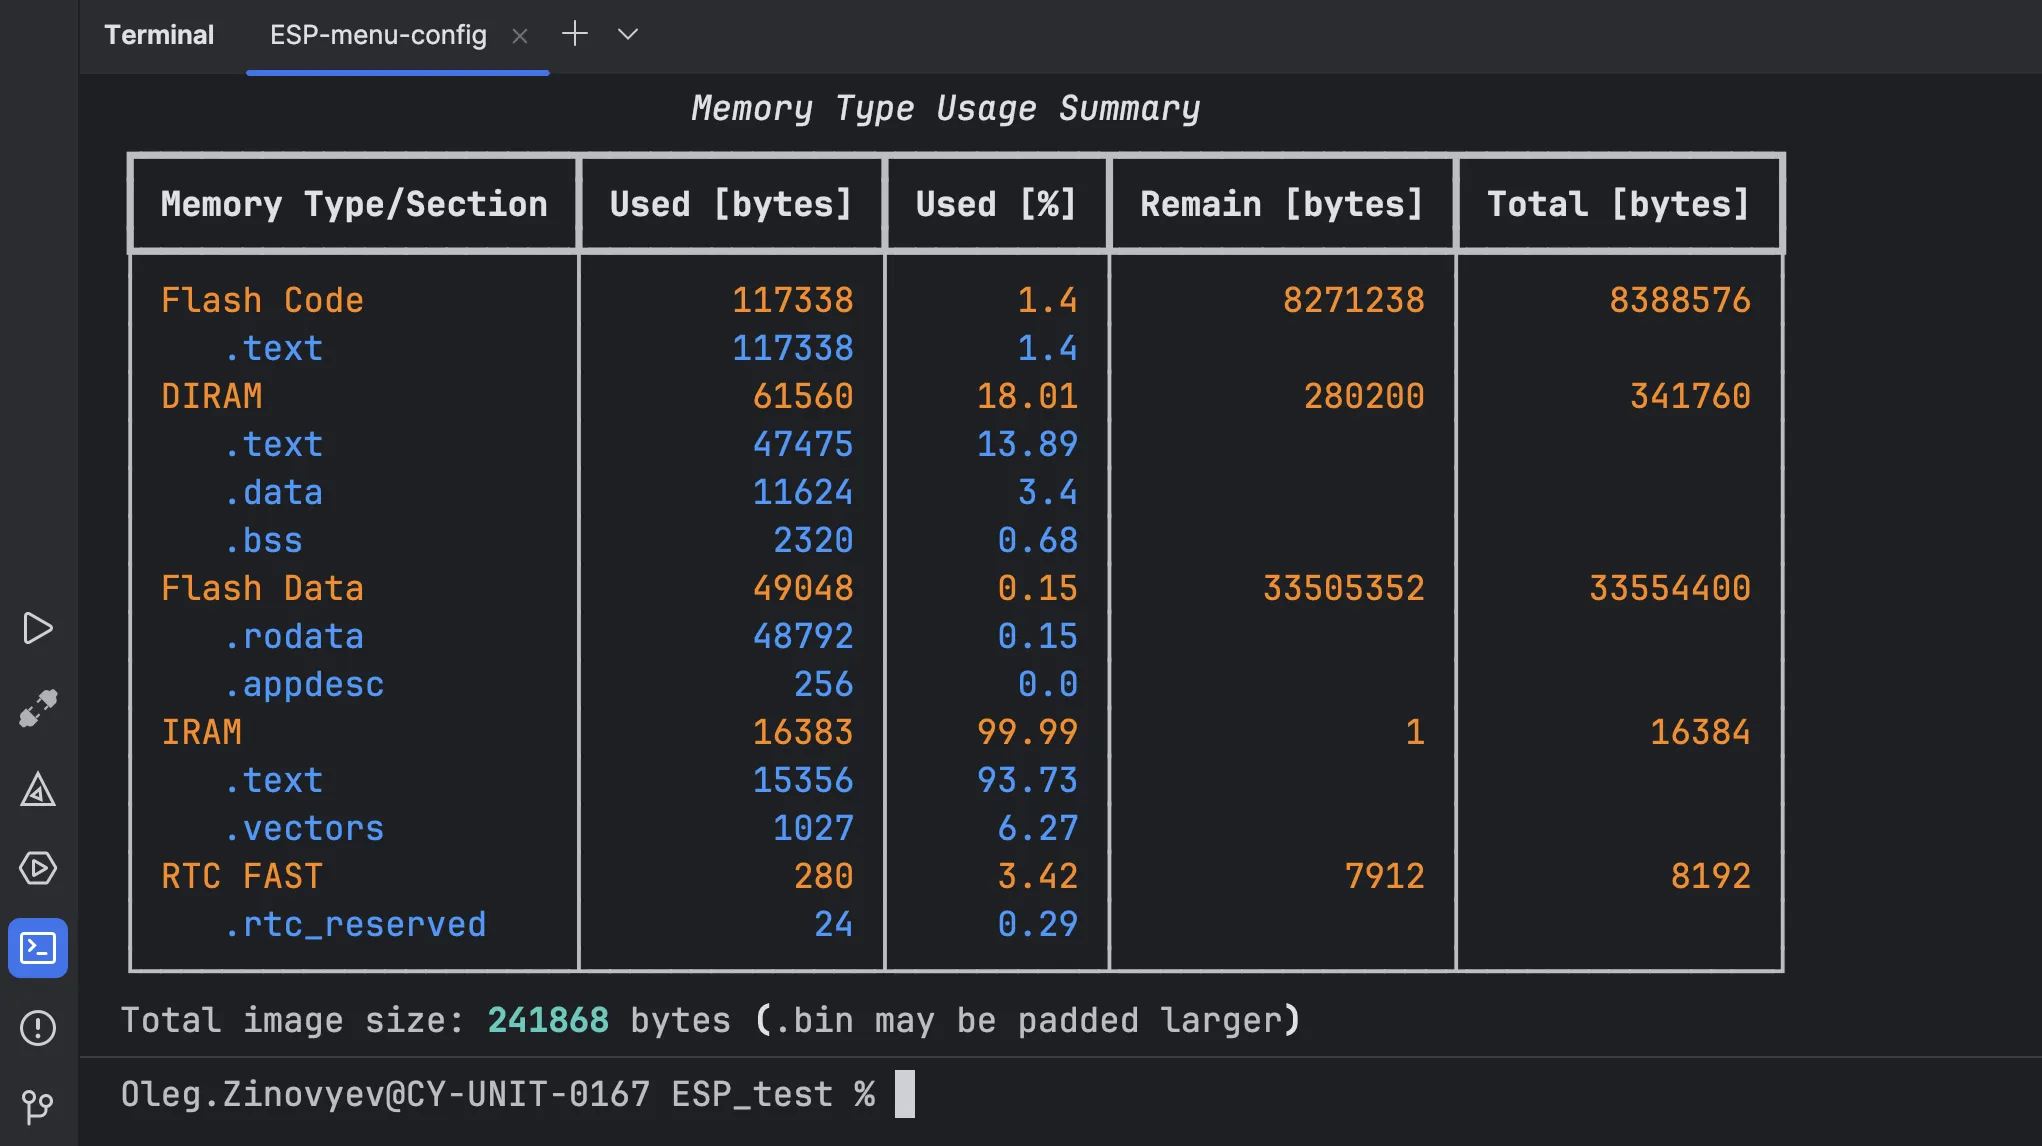
You can also use the idf.py command with various options in the terminal to manage your project and examine its configuration. For example, here is the output of the idf.py. size command showing the firmware size:
You can configure commands you often use as shell scripts and run them as separate configurations, as you did earlier when accessing the serial monitor port and project configuration menu.
To learn more about the idf.py options, read the official documentation.
Debugging a project#
We’ll use the Debug Servers configuration option to debug the project. This CLion feature provides a convenient way to configure and use a debug server with different build targets.
- Unplug the USB cable from the board’s UART connector and plug it into the USB connector.
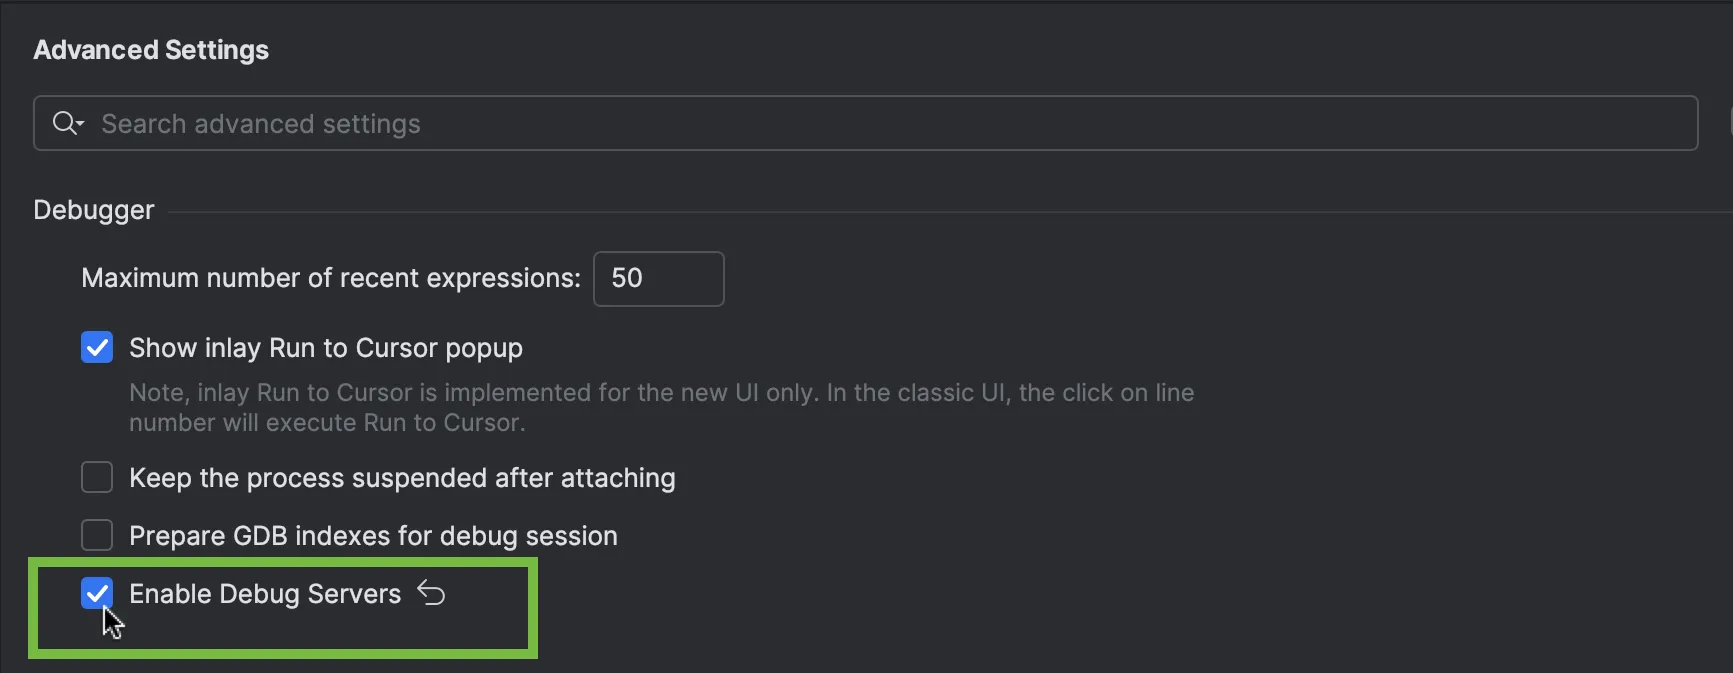
- Make sure
Debug Serversare enabled inSettings>Advanced Settings>Debugger.
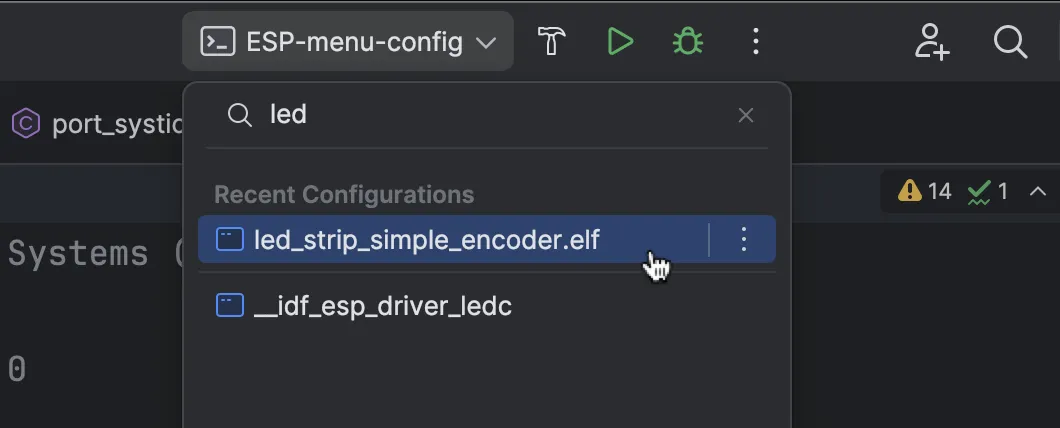
- Select the
led_strip_simple_encoder.elfconfiguration from the main toolbar switcher.
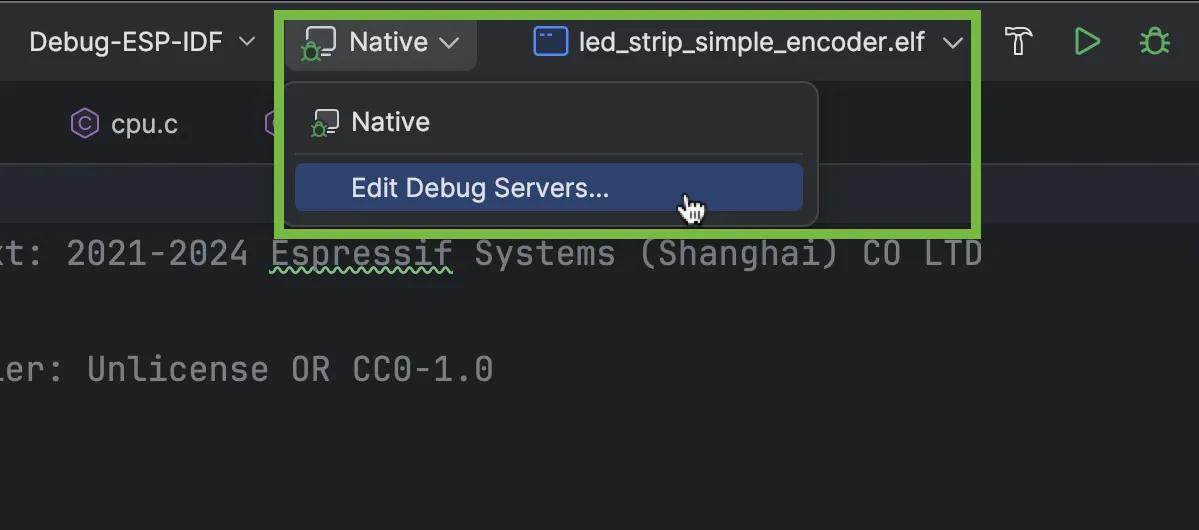
After that, the Debug Servers switcher appears in the main toolbar.
- Select
Edit Debug Servers.
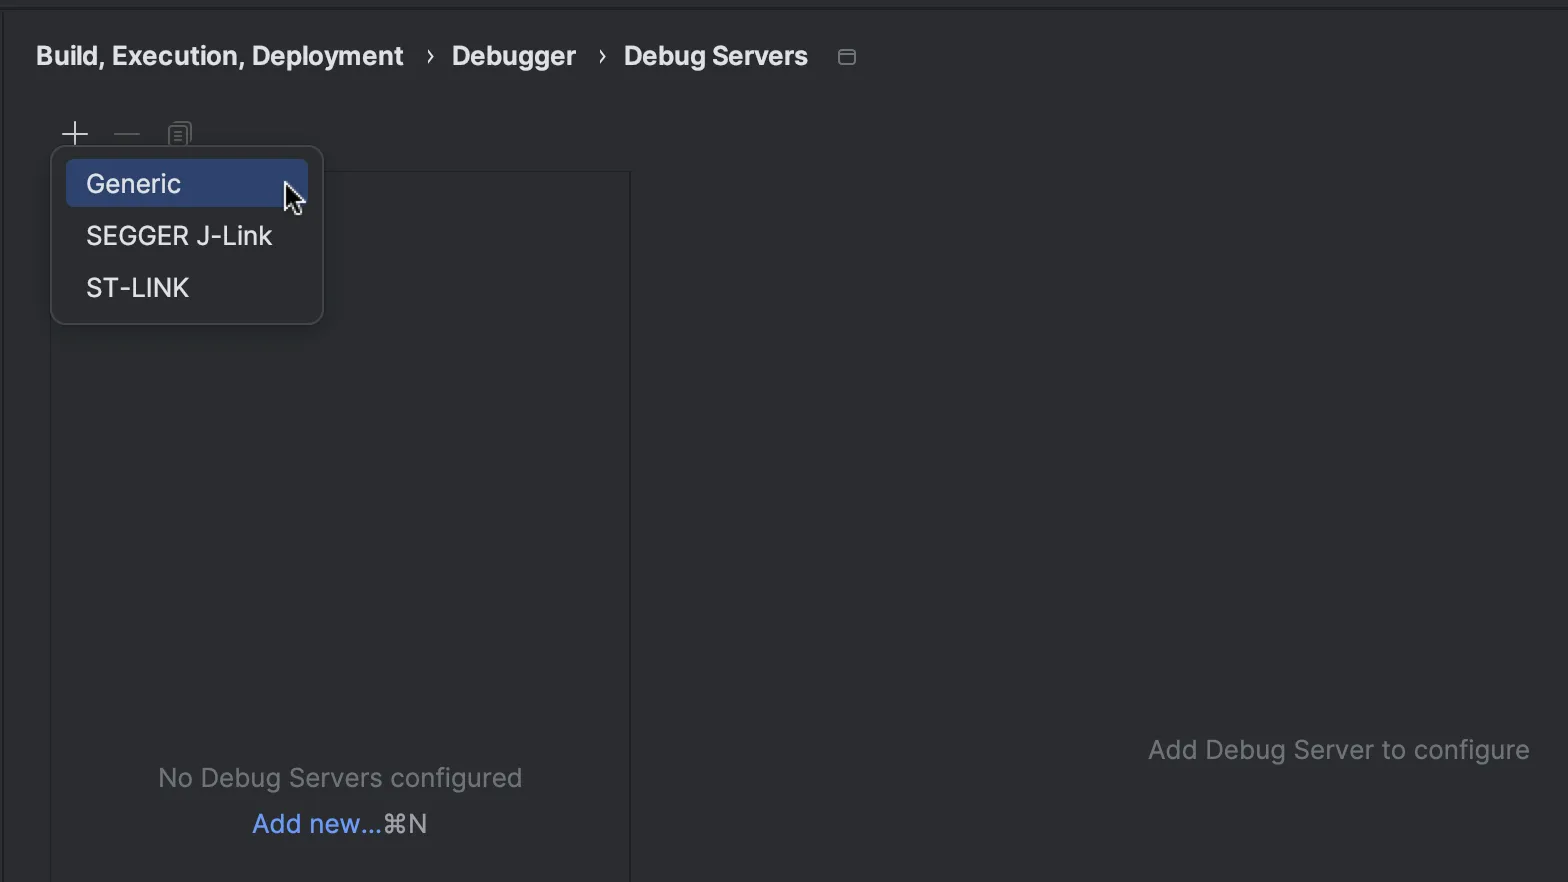
- Click
+to add a new debug server. - Select the
Generictemplate.
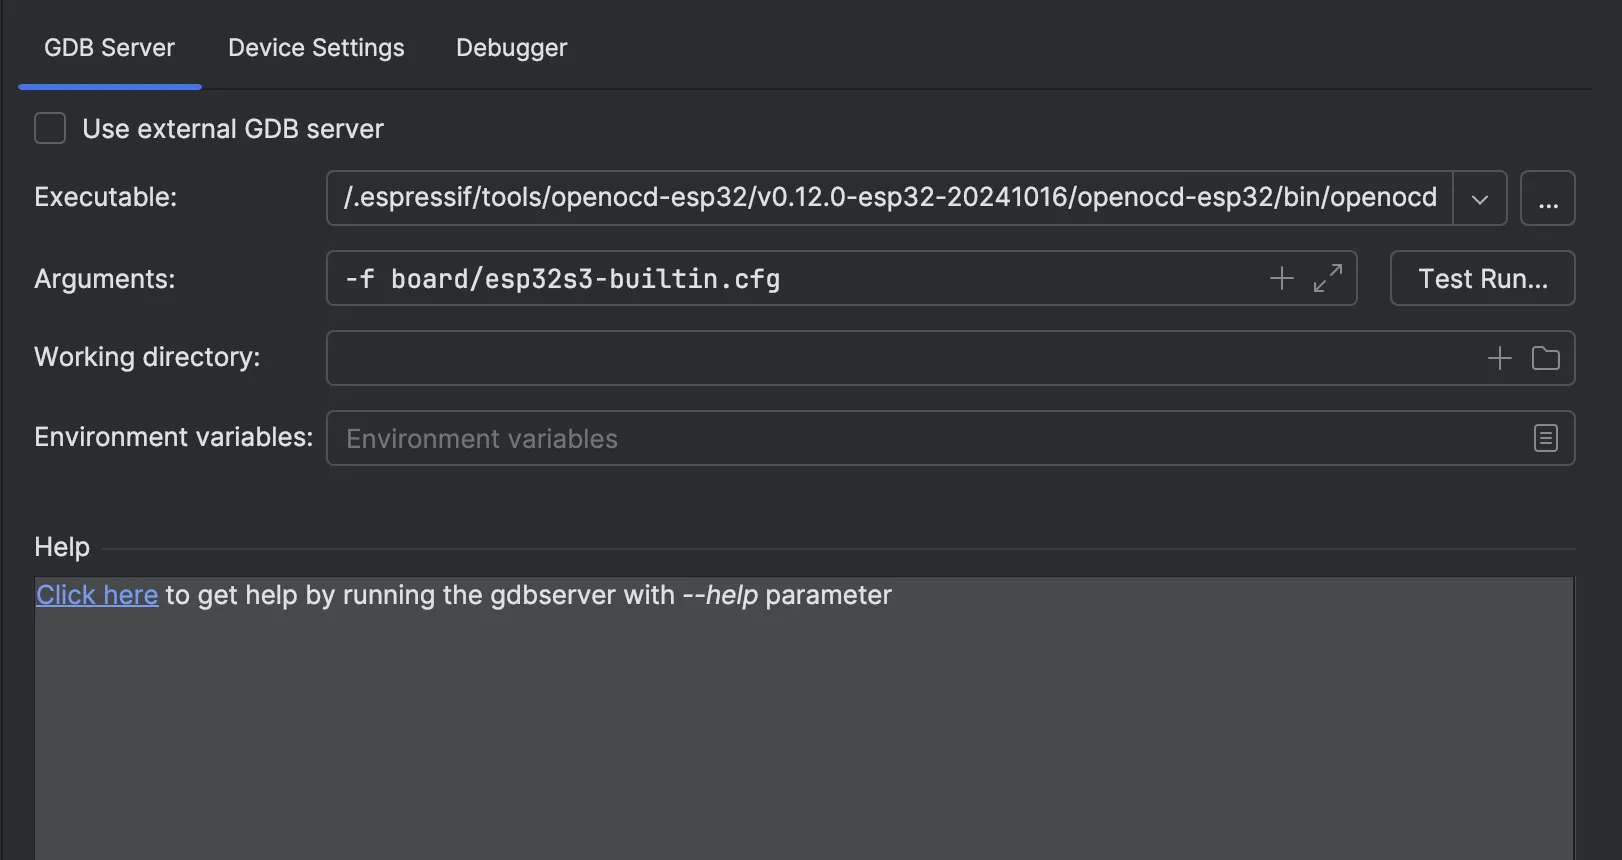
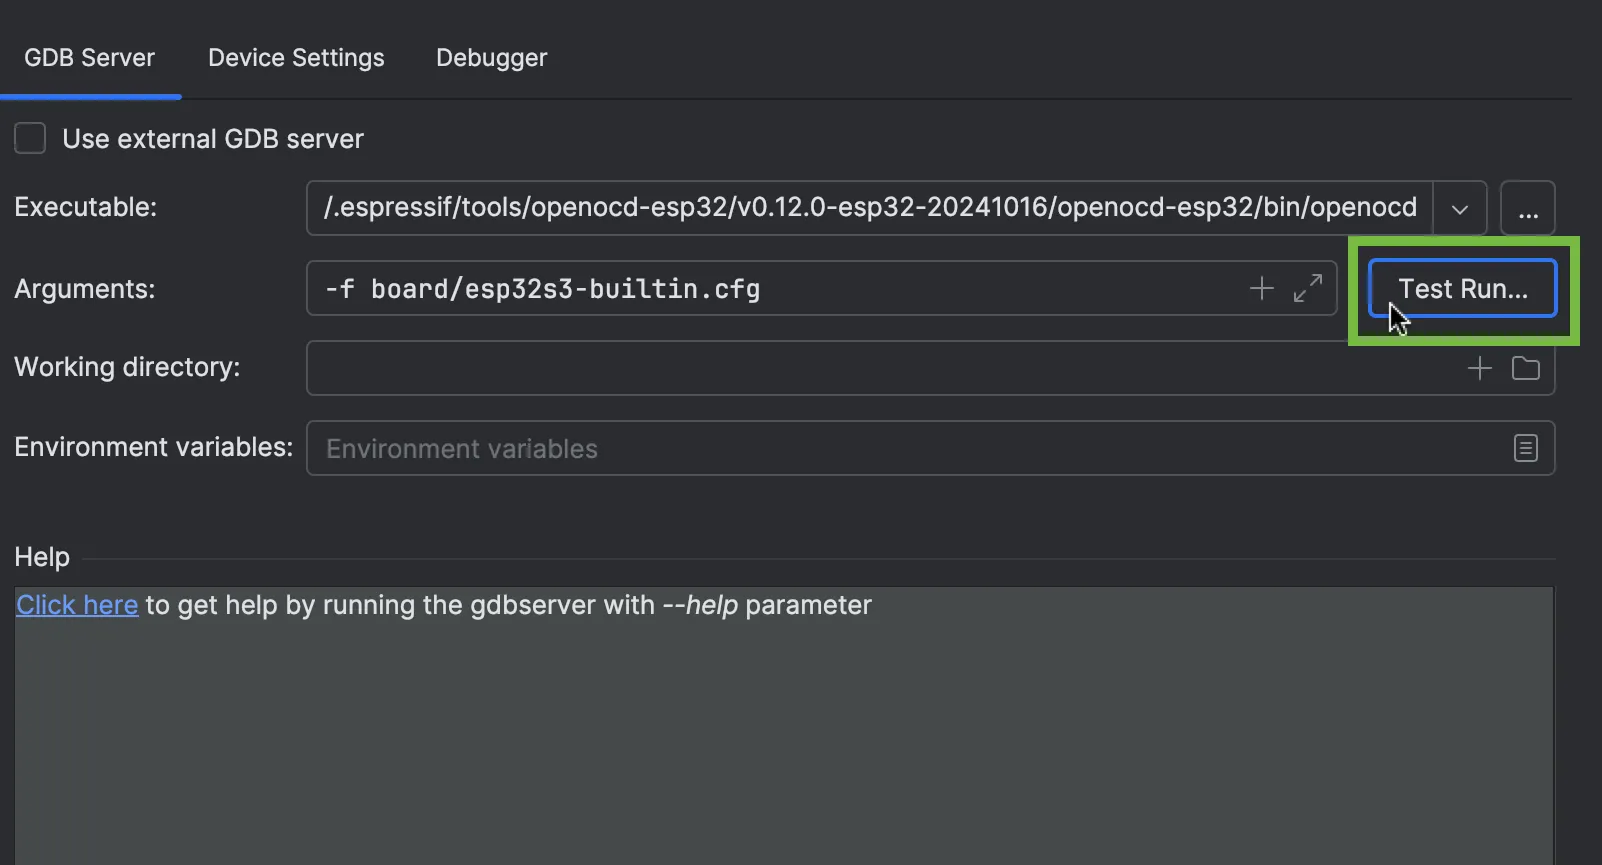
Here, you need to specify several parameters, some of which depend on your board. For this tutorial, we’ll use the following:
GDB Server>Executable:/Users/Oleg.Zinovyev/.espressif/tools/openocd-esp32/v0.12.0-esp32-20241016/openocd-esp32/bin/openocdGDB Server>Arguments:-f board/esp32s3-builtin.cfg
- The
Device Settingsare as follows:
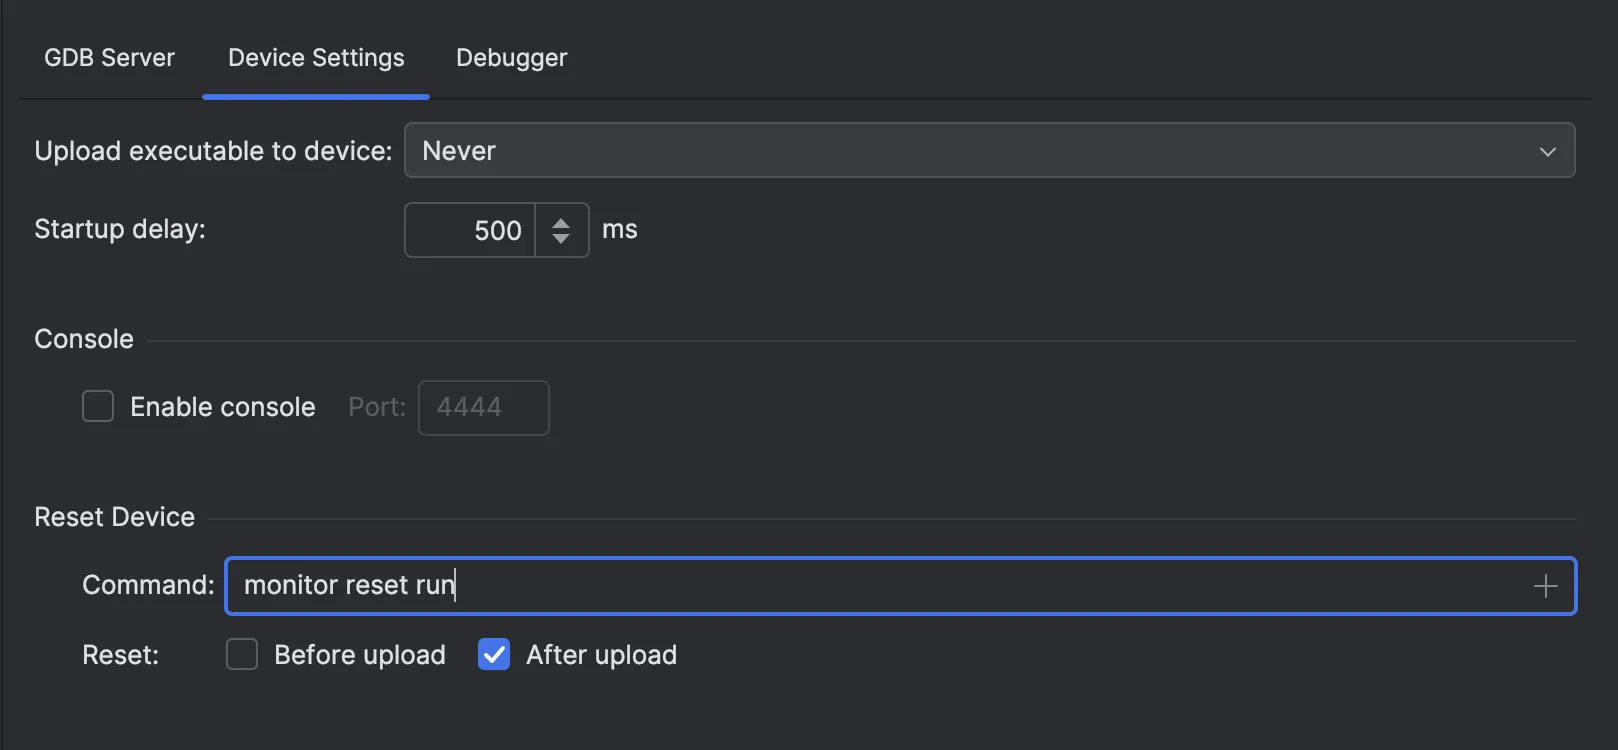
Debugger>Custom GDB Executable:/Users/Oleg.Zinovyev/.espressif/tools/xtensa-esp-elf-gdb/14.2_20240403/xtensa-esp-elf-gdb/bin/xtensa-esp32s3-elf-gdbDebugger>Connection>Arguments:tcp::3333
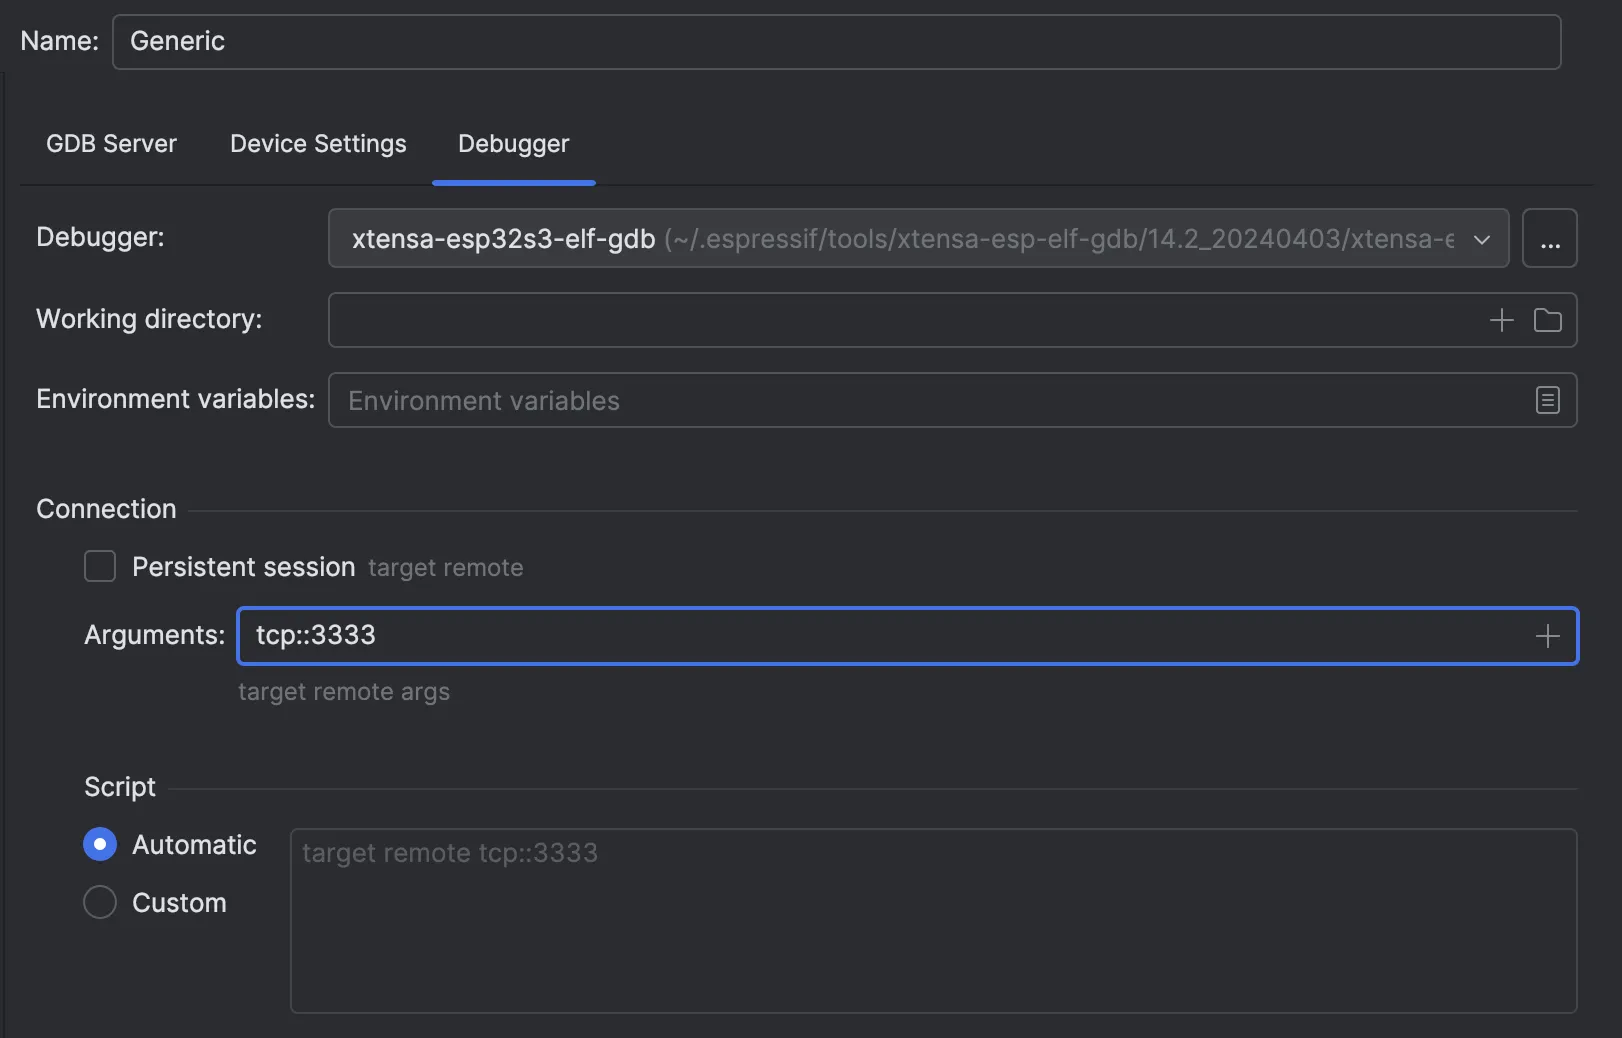
Also, it’s best to disable the Persistent session option on the Debugger tab, as it can be unstable.
- Leave the rest of the default settings as they are and click
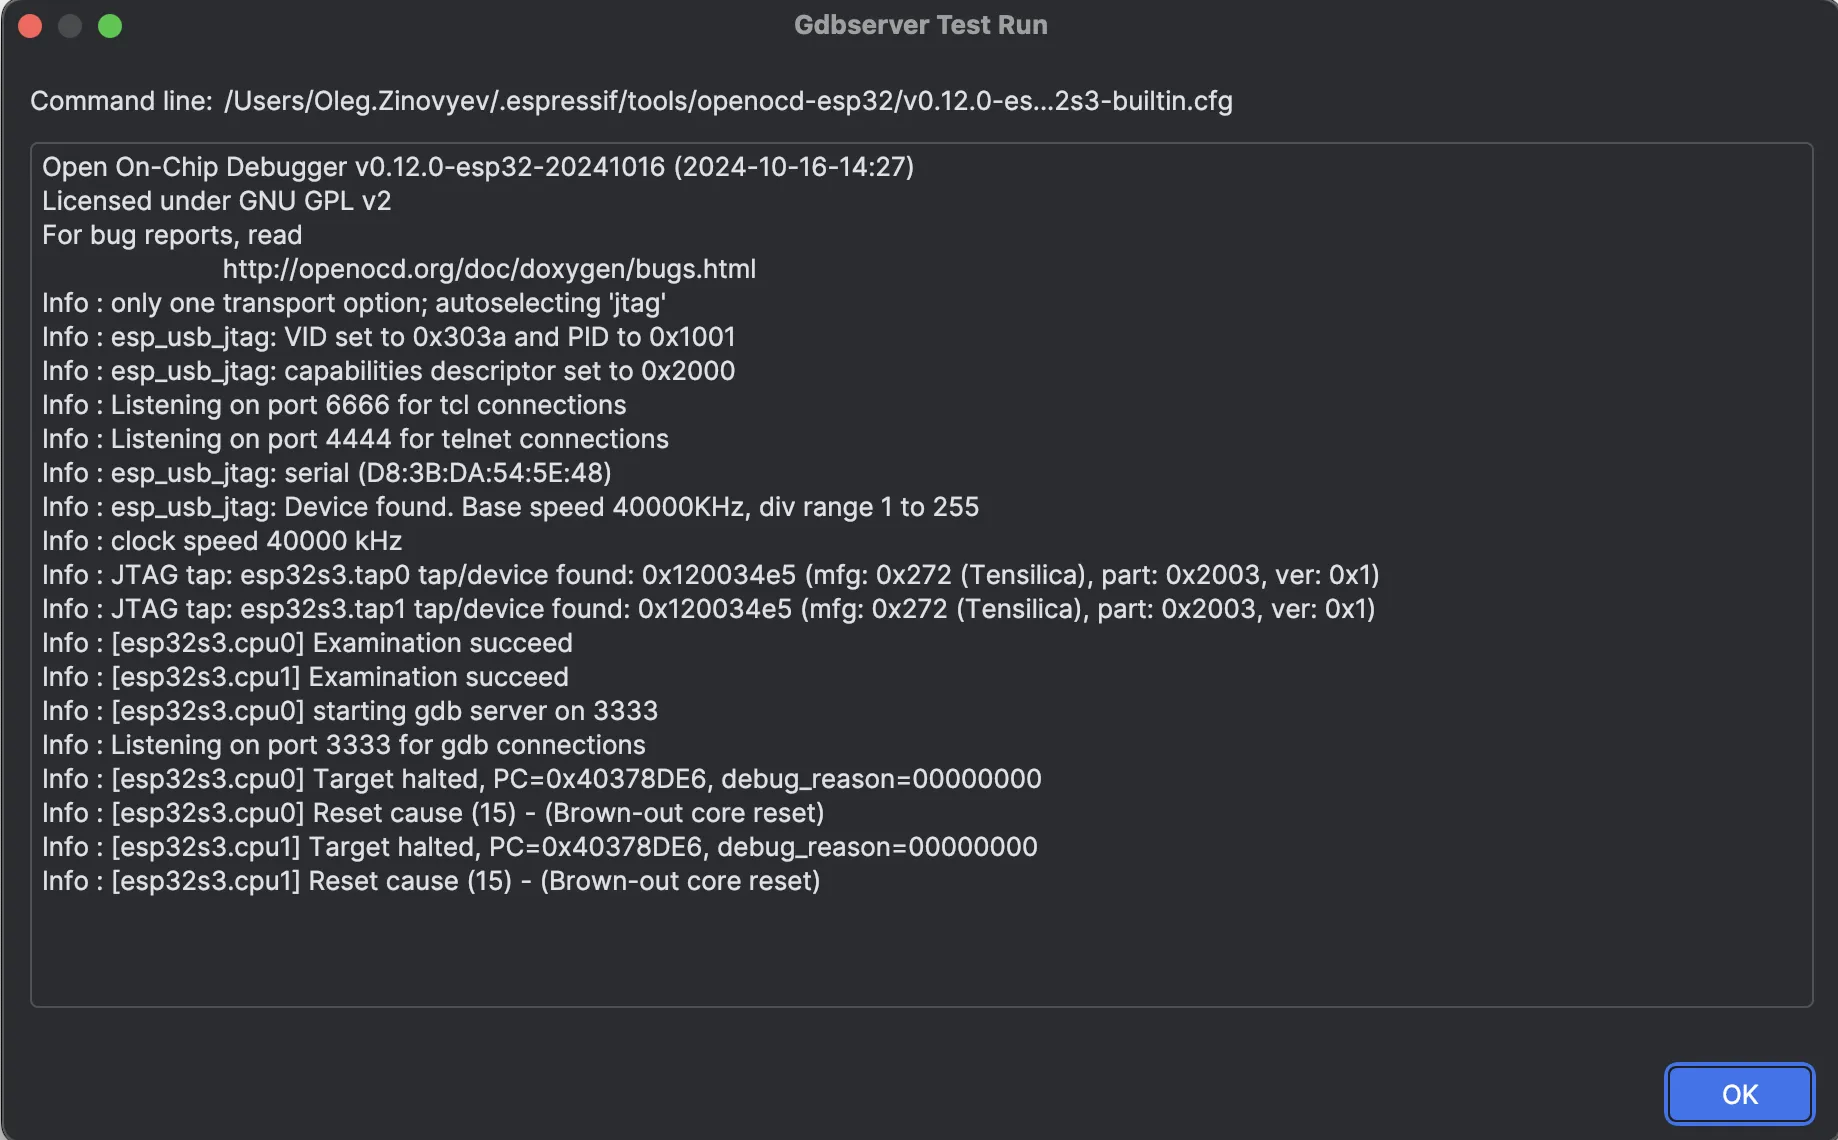
Apply. - You can also run the GDB server in test mode to verify that the settings are correct.
Here is what the Test Run... output looks like when the test is successful:
- Save your changes and close the
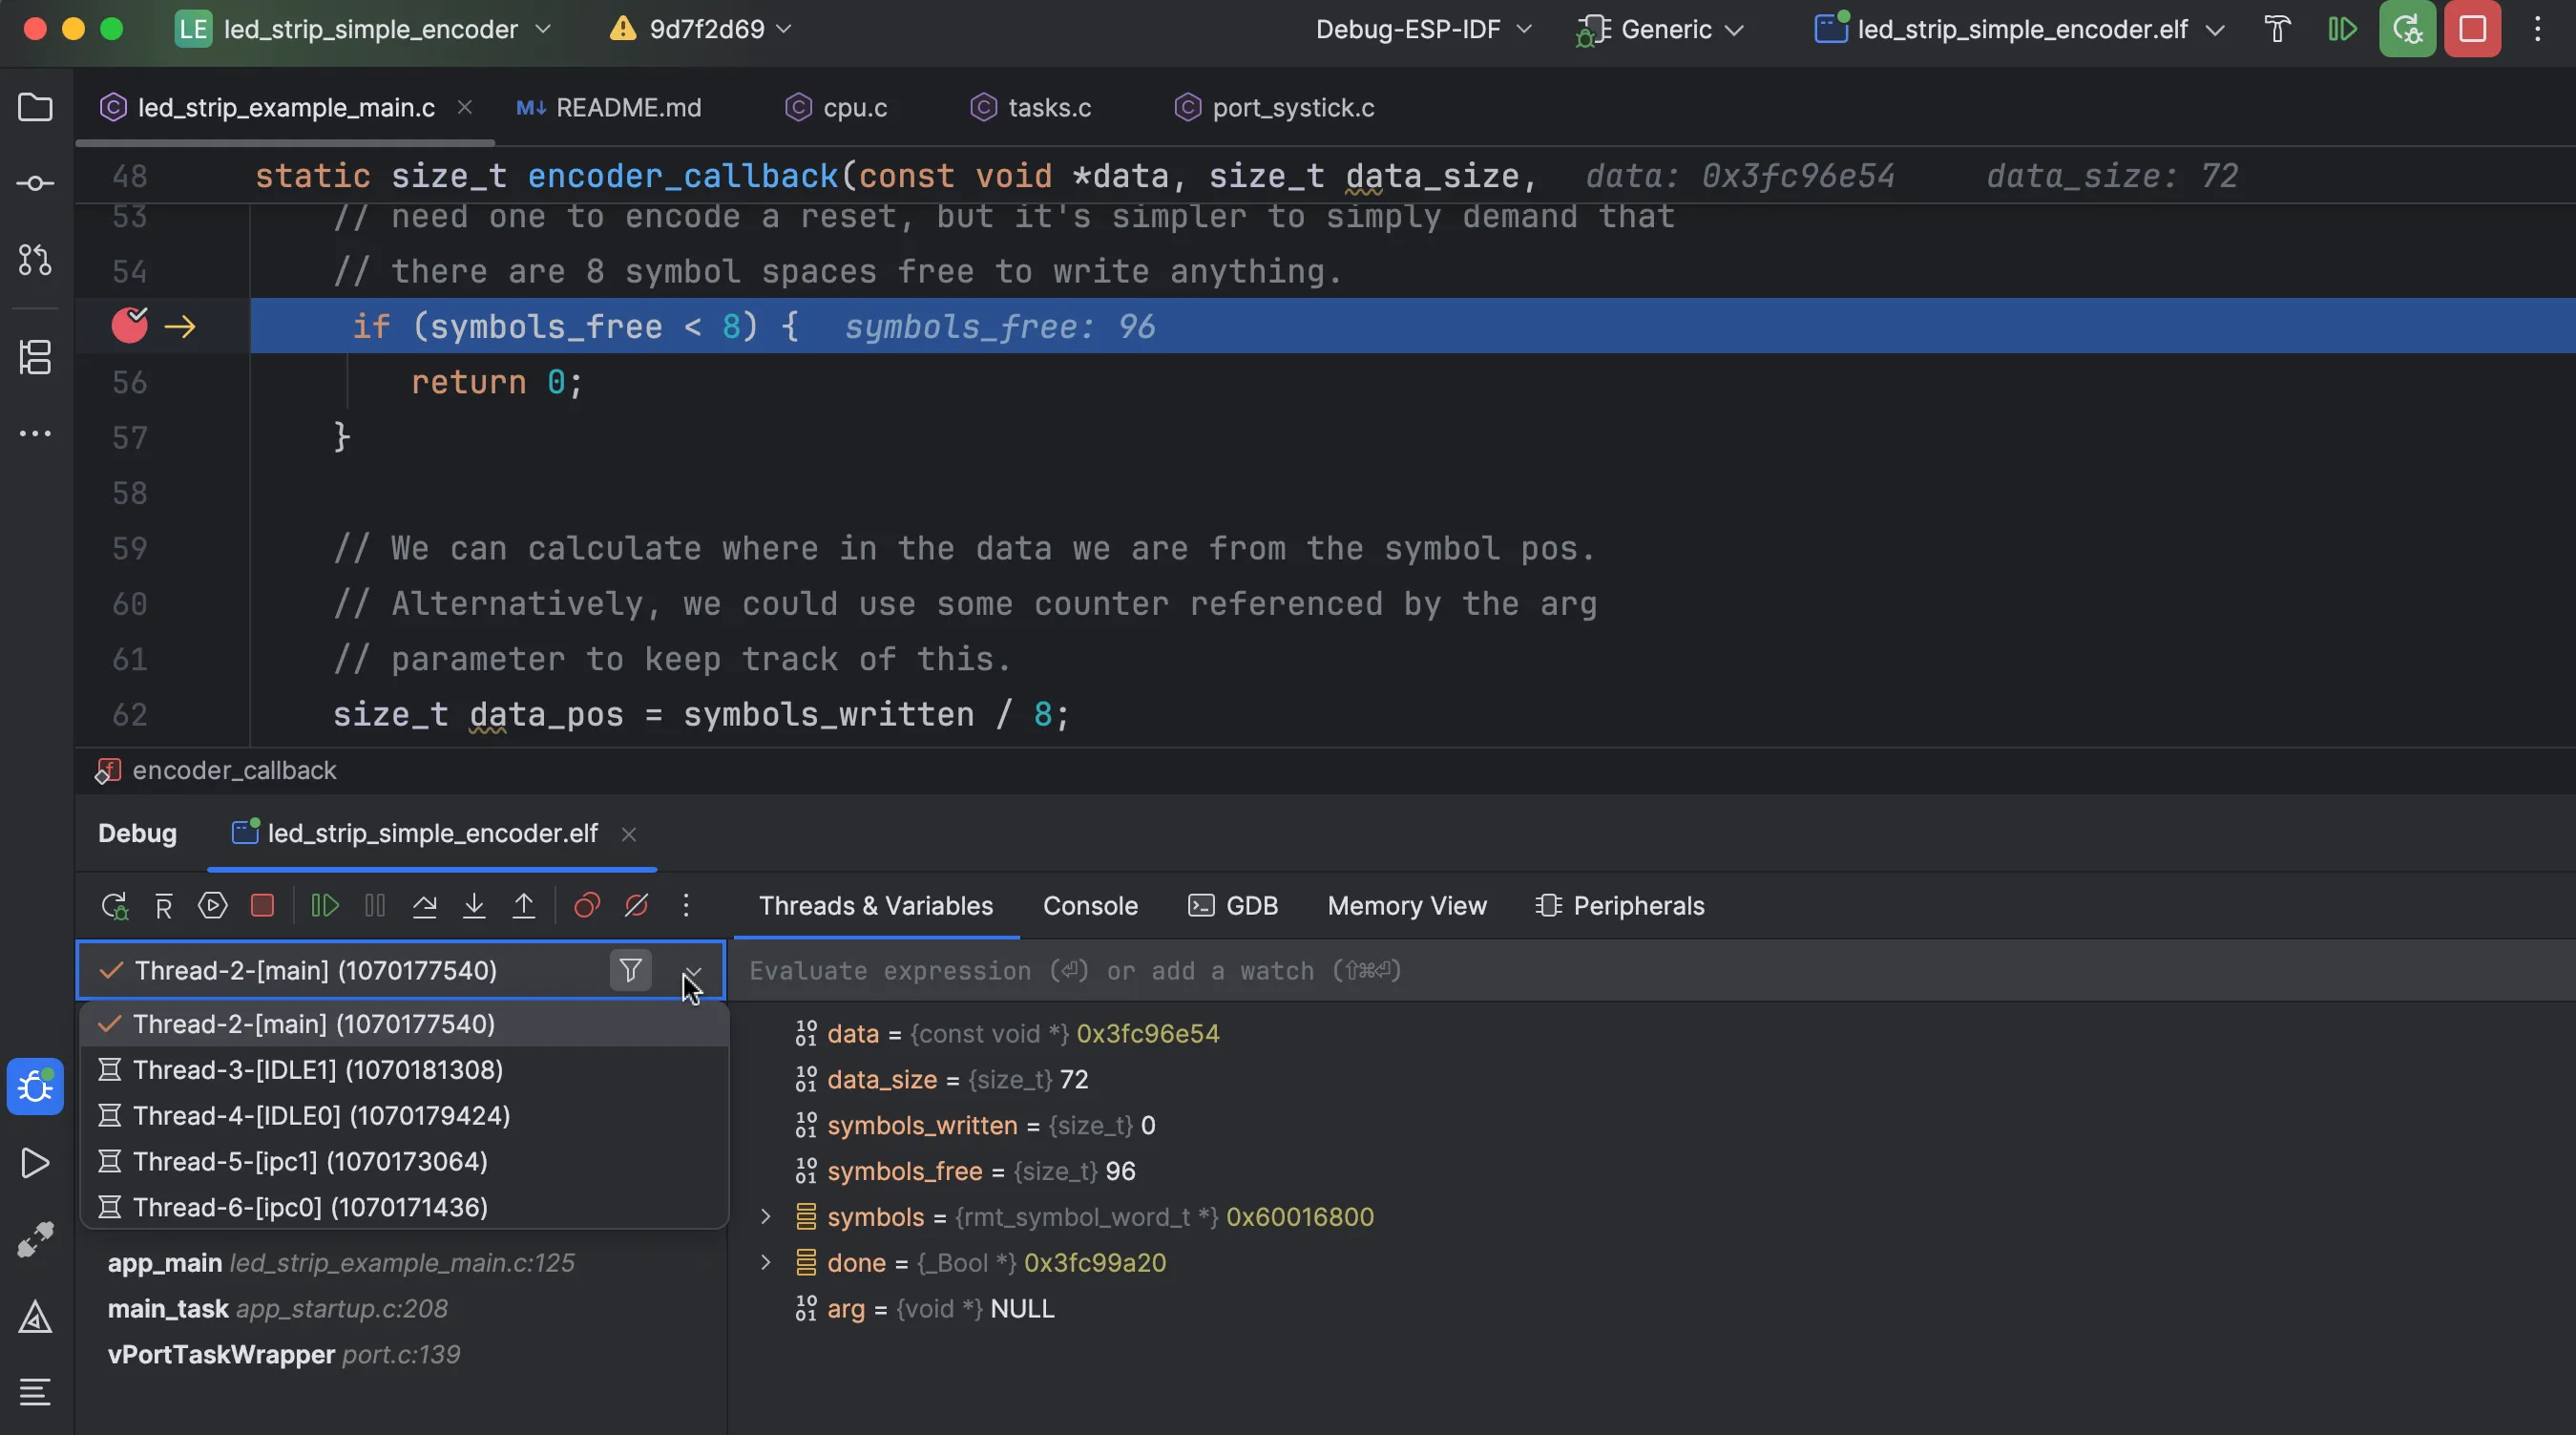
Debug Serversconfiguration dialog. - Set a breakpoint in your source code file.
- Click the green
Debugicon on the main toolbar. The debug session will start.
You can then perform the necessary debugging actions and examine the application data.
To learn more about CLion’s debugger features, read the IDE’s documentation.
For further guidance about debugging your specific ESP32 chip, refer to the manufacturer’s documentation. There may be some peculiarities related to JTAG settings that you need to be aware of when configuring a debug server for a specific chip.
Conclusion#
At CLion, we strive to make the IDE a universal and convenient tool for developing any embedded system, whether hardware, framework, or toolchain. The same is true for ESP-IDF: We plan to simplify the workflow for these projects and are actively working on it.
We’d appreciate it if you use this tutorial for your ESP-IDF project and give us your feedback. If you have anything to share or if you encounter any problems, please let us know through our issue tracker.