
This article outlines a quick and easy way to start a debugger from the command line. More specifically, it discusses the debugging targets of idf.py, which have been added to ESP-IDF from v4.2. At the time of writing, IDF v4.2 is not released yet, but you can try out this feature on the master branch.
Why Do We (Not) Debug#
Debugging is an essential development technique, no less so for embedded platform engineers. However, getting the debugging tools to work on embedded platforms is often more complex. Also, asking an ESP32 developer how they debug suggests that the ESP platform may be just as complex, because the more common answers seem to favor printf()s or GPIO toggling as a debugging technique.
Check It Out#
Many developers who work with ESP-IDF rely on the command line tools for configuring, building, and debugging their applications. Although IDE plugins are also available (Espressif IDF Eclipse Plugins, ESP-IDF Visual Studio Code Extension), they are not the subject of this article. idf.py is the main command tool in ESP-IDF CMake based build system. It is most often known for the idf.py menuconfig and idf.py flash monitor commands.
Debugging commands are available, as well, to make the JTAG configuration easier to use. To explore this option, let’s just connect an ESP32 WROVER-KIT, and start building a project by typing:
idf.py flash monitor openocd gdbgui
This command does several things:- flashes the application to the development board- opens IDF Monitor to observe serial output- starts OpenOCD debugger and a gdbgui debug server- opens a web browser, where gdbgui interface is displayed.
Overview of the New Debugging Targets#
idf.py now implements the actions described below. For instructions on setting up JTAG debugger with an ESP32, see the JTAG debugging section in IDF programming guide. Please note that a board with JTAG interface must be connected to use any of these debugging targets.
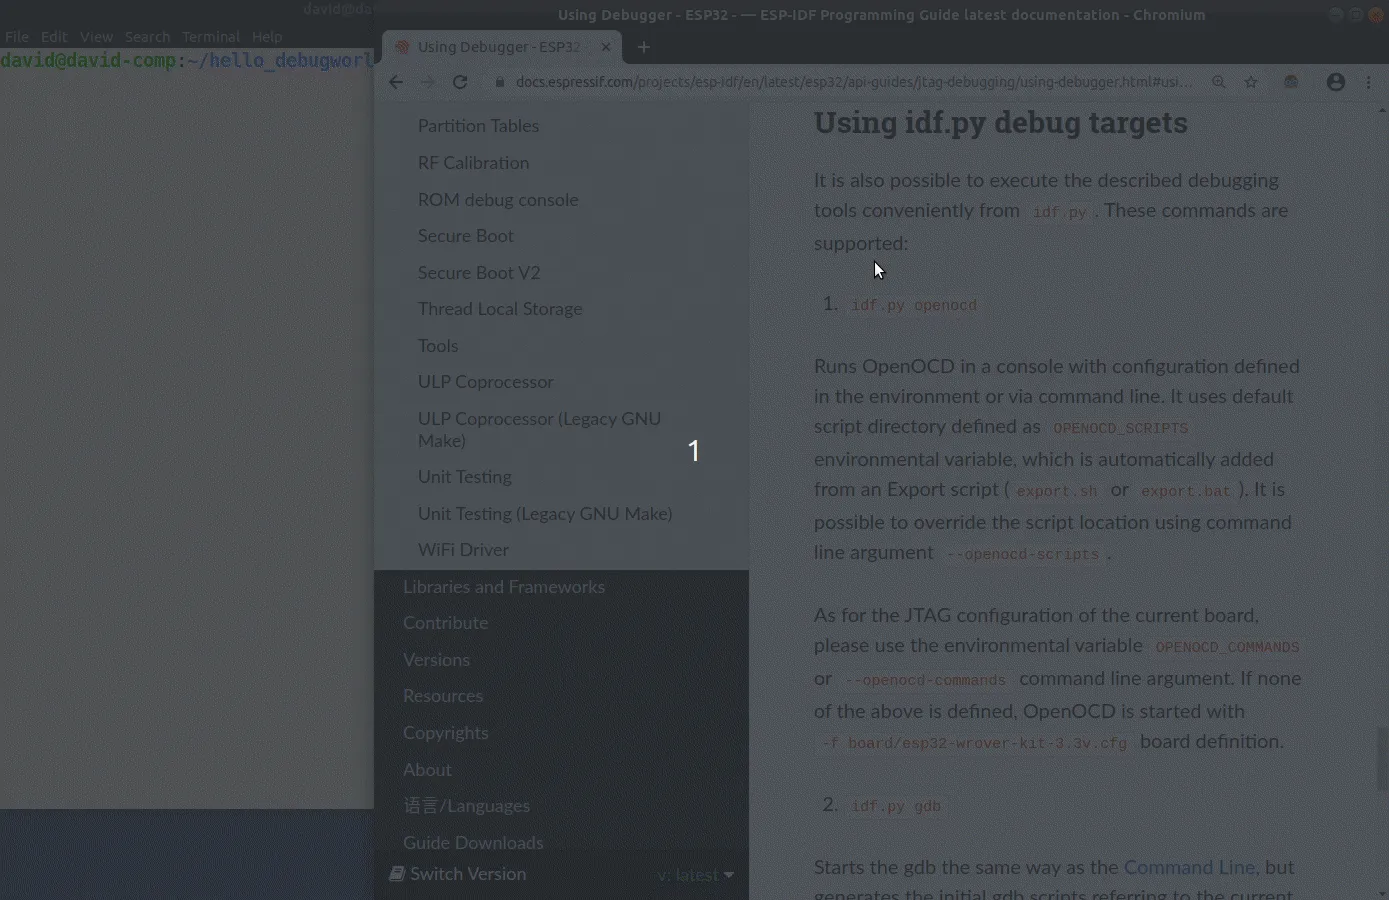
idf.py openocd#
Runs OpenOCD in a console with configuration defined in the environment or via command line.
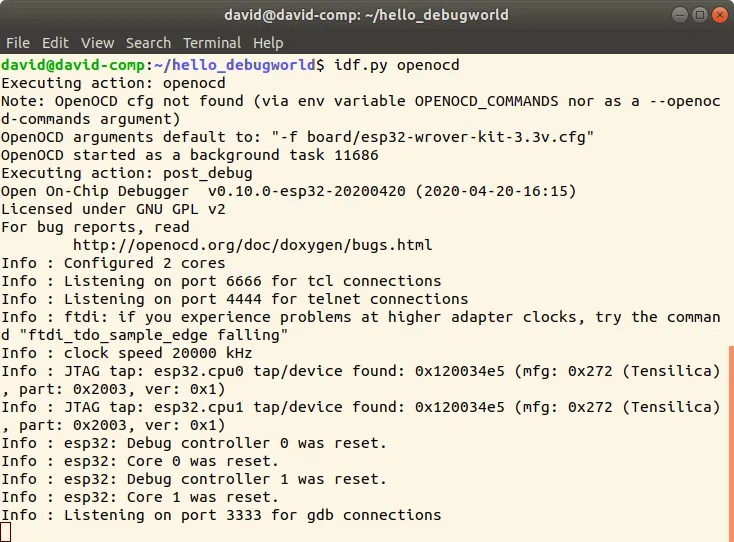
By default, it is assumed that ESP32 WROVER-KIT board with 3.3V flash is used. This configuration also works with an ESP32 Ethernet Kit and many other boards. To override the default, set OPENOCD_COMMANDS environment variable or pass an –openocd-commands argument.
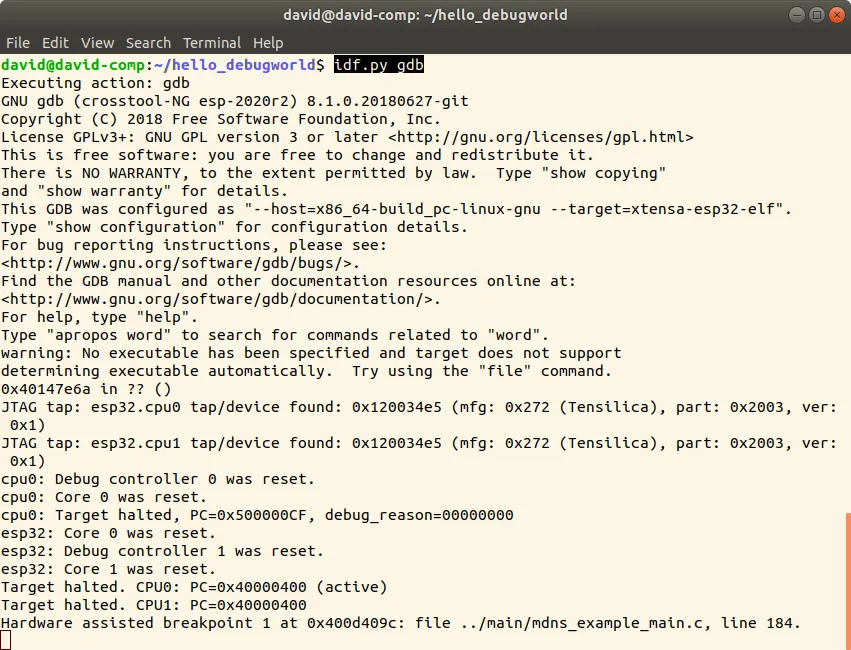
idf.py gdb#
Starts the gdb in the current active console with the project’s elf file.
idf.py gdbtui#
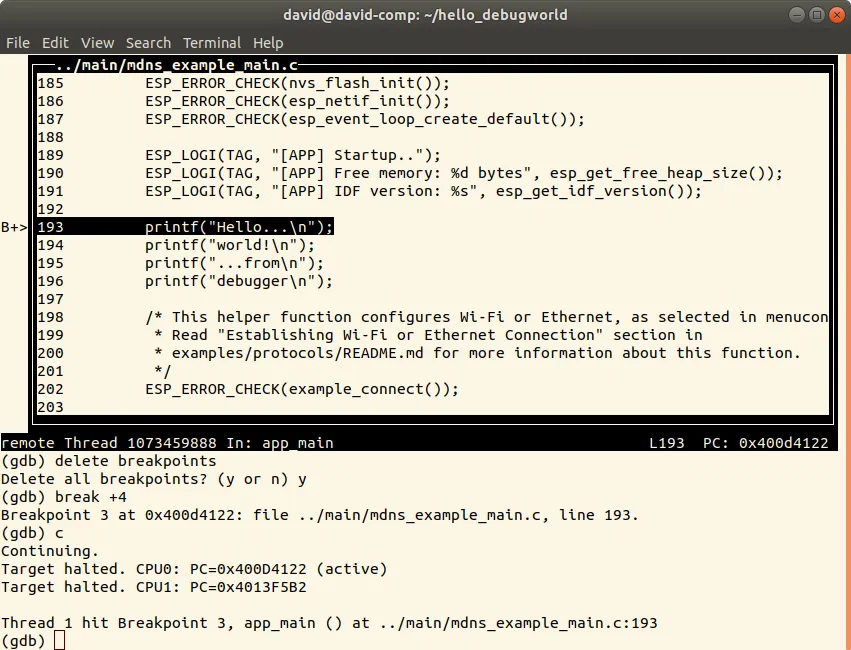
Starts the gdb the same way as above, but with the –tui argument allowing very simple source code view in a textual user interface mode.
idf.py gdbgui#
Starts gdbgui debugger frontend enabling out-of-the-box debugging in a browser window.
Putting More Actions Together#
It is possible to combine multiple debugging actions on a single command line, thus allowing a convenient setup of blocking and non-blocking actions in one step.* * idf.pyimplements a simple logic to move the background actions (such as OpenOCD) to the beginning, and the interactive ones (such as gdb or monitor ) to the end of the action list.
An example of a very useful combination is shown below with the corresponding screenshot.
idf.py gdbgui monitor openocd
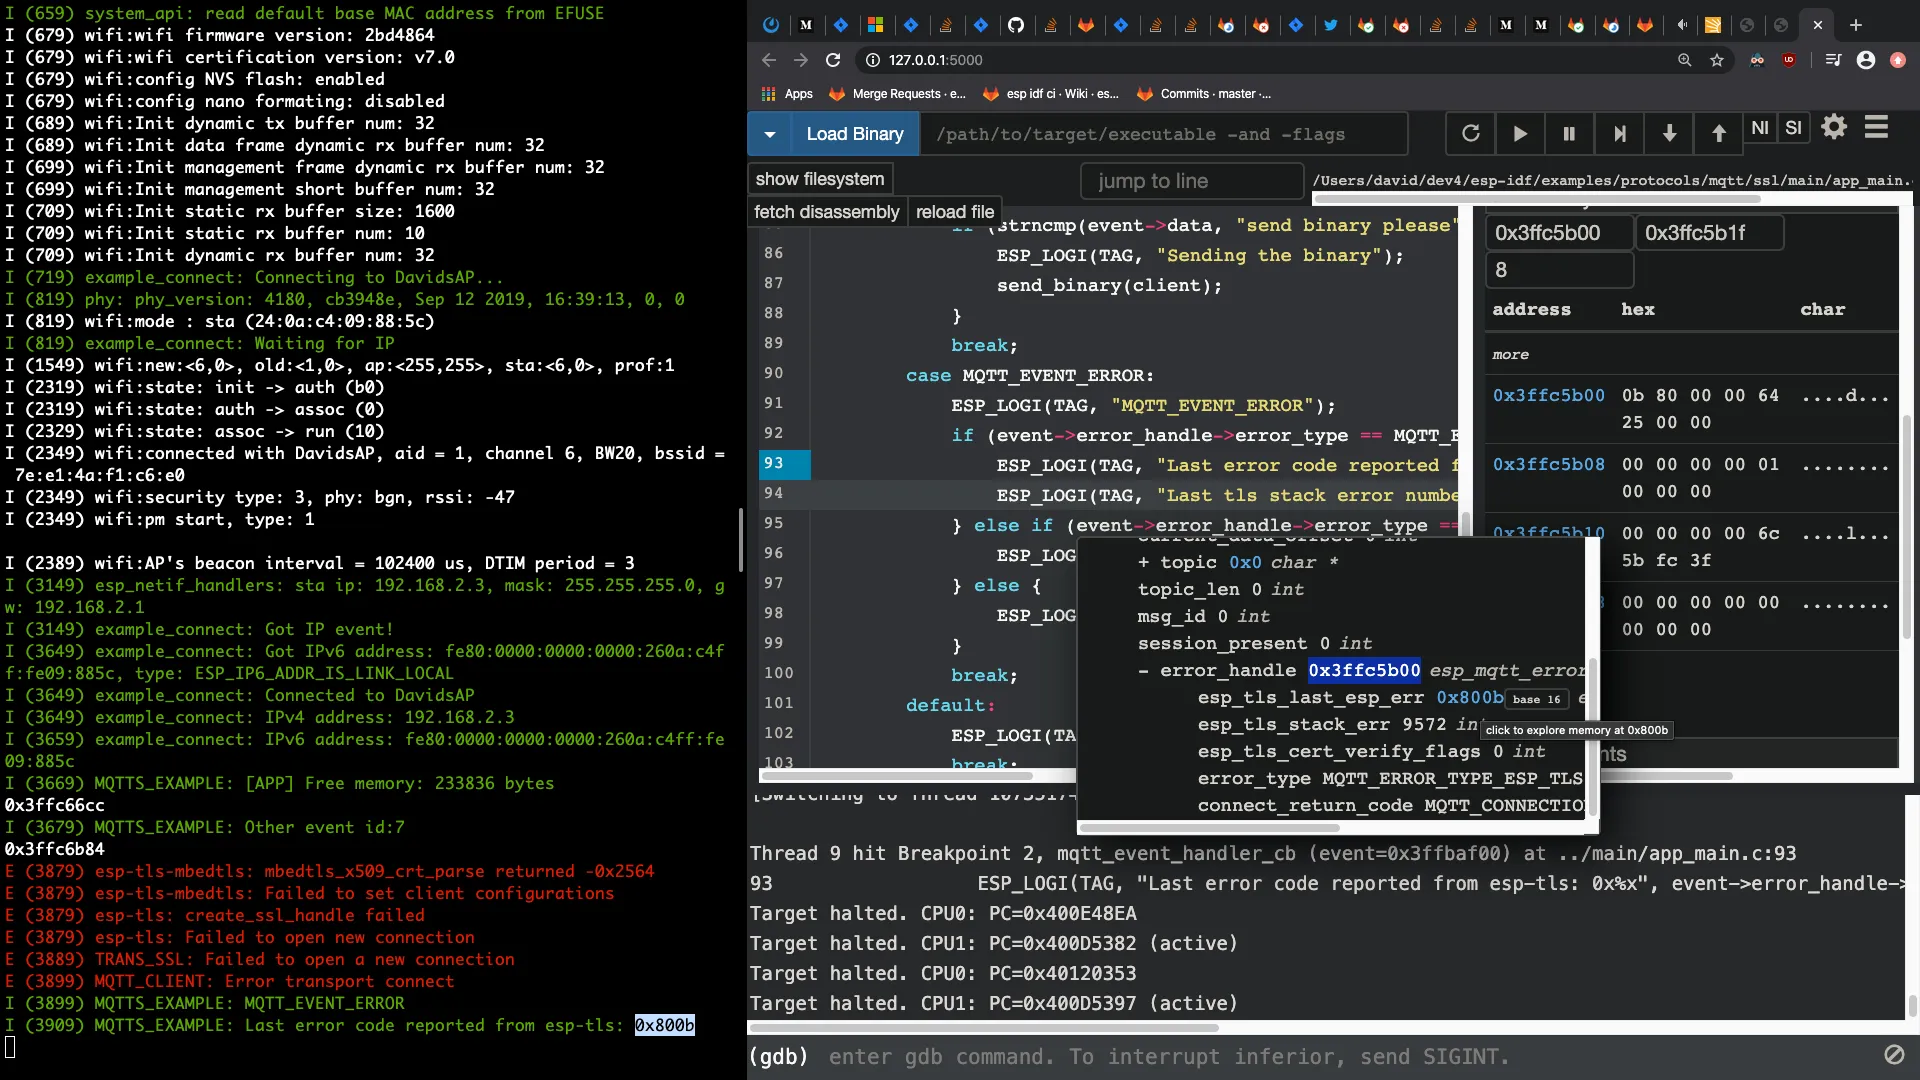
This command starts OpenOCD in the background, while it opens gdbgui in a browser and the IDF-monitor in the active console window, allowing the user to observe serial output and debug it at the same time. When the monitor exits with Ctrl + ], all debugging actions are terminated and cleaned up.
Explore JTAG#
If you are a “command-line person” or a dedicated IDE user, please step into these new debugging functions and give them a try to explore the ESP chips from the JTAG perspective!
For More Information#
- Official documentation of JTAG Debugging with idf.py
- idf.py help or a contextual help related to the specific targets below:
idf.py openocd --help
idf.py gdb --help
idf.py gdbtui --help
idf.py gdbgui --help