
The core purpose of ESP Insights Dashboard has always been to help quickly identify a group of nodes which are showing similar behaviour patterns with the help of powerful search filters. Further it helps the user to reach to a particular node and help diagnose the reason behind the node showing a certain behaviour. The user can then check the event logs or point in time metrics and system variable values and correlate any diagnostic information at hand. More in detail about group analytics and search filters can be found here.
The need for custom dashboards#
Each ESP Insights user may have a different perspective of looking at their device data. A user in developer role , may be using the dashboard more from diagnostics purposes and interested in understanding the crashing devices or the reboot pattern of devices. Whereas another user in product manager role might be using it from analytics insights purposes and interested in just looking at the spread of online devices of particular type(s) and at particular times in a day or a week or a month. In order to cater to individual perspectives, sticking to just one default view and asking the user to set the filters every single time was not scoring on the user experience. Thus came the improvement to make it easier for the end users to save their custom dashboard with their search filters applied and preserved. A user can save multiple dashboards as per their need and intention of use viz. Crashing Devices Dashboard or Led Light v5.0 Devices (light devices with firmware version 5.0) and so on so forth.
Managing your dashboards#
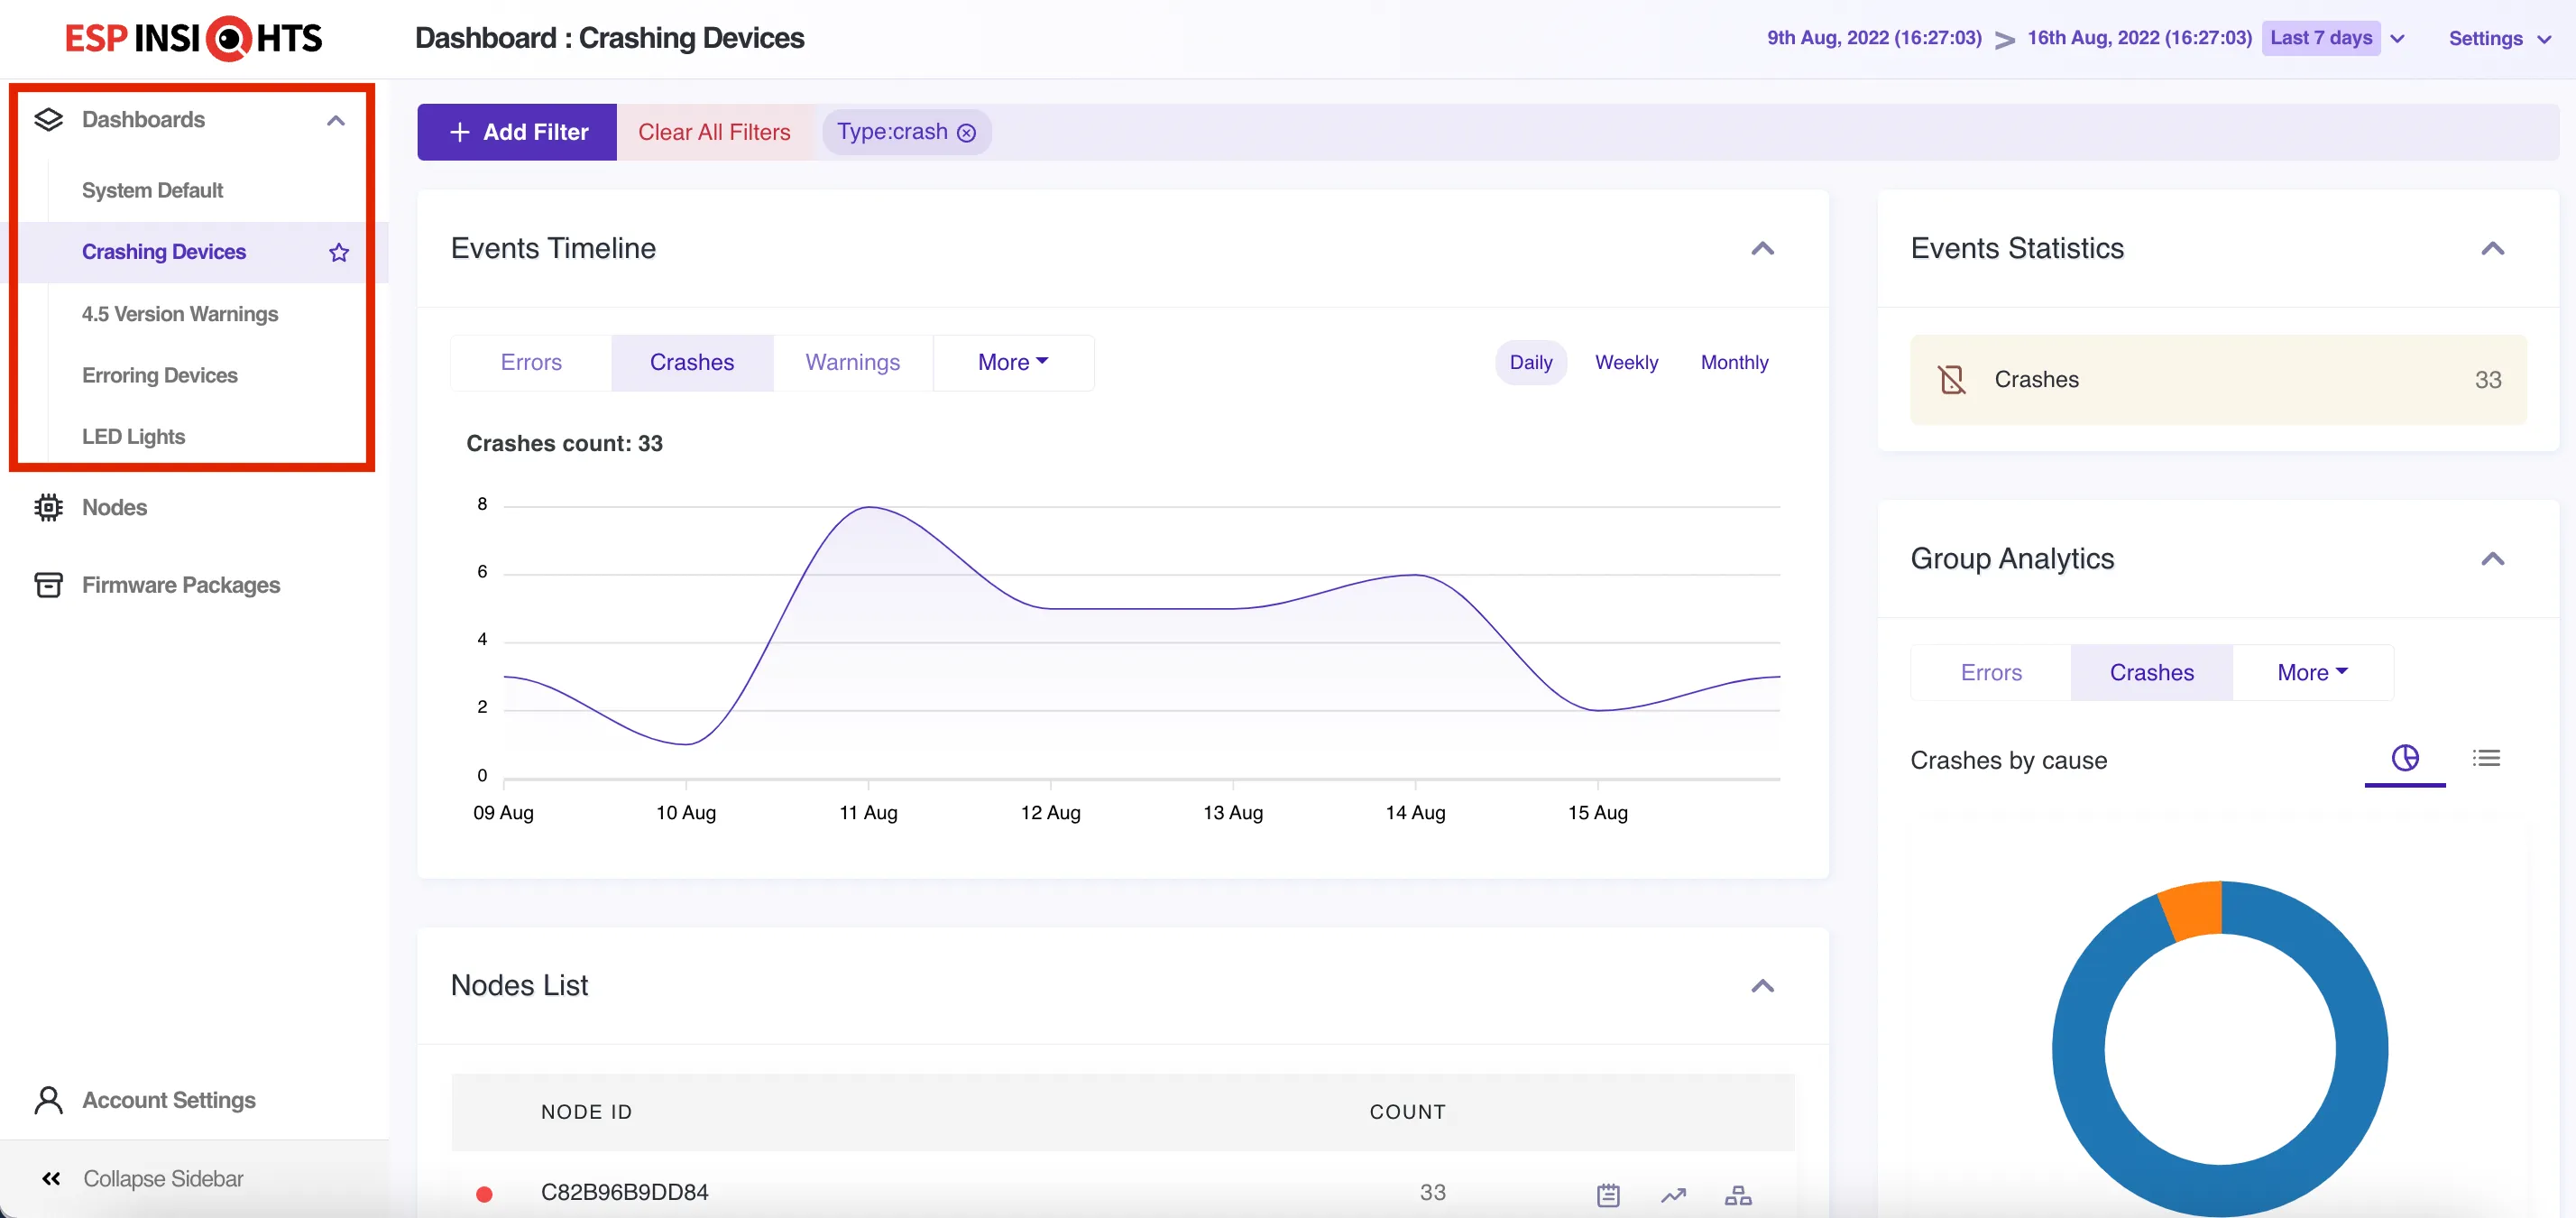
As can be seen in the above image, there are multiple dashboards created, each for a different purpose, and filtering devices accordingly. While the “Crashing Device Dashboard” lists devices reporting crashes in last 7 days, there is another dashboard named “LED Lights” which just lists devices with firmware project as “led_lights”.
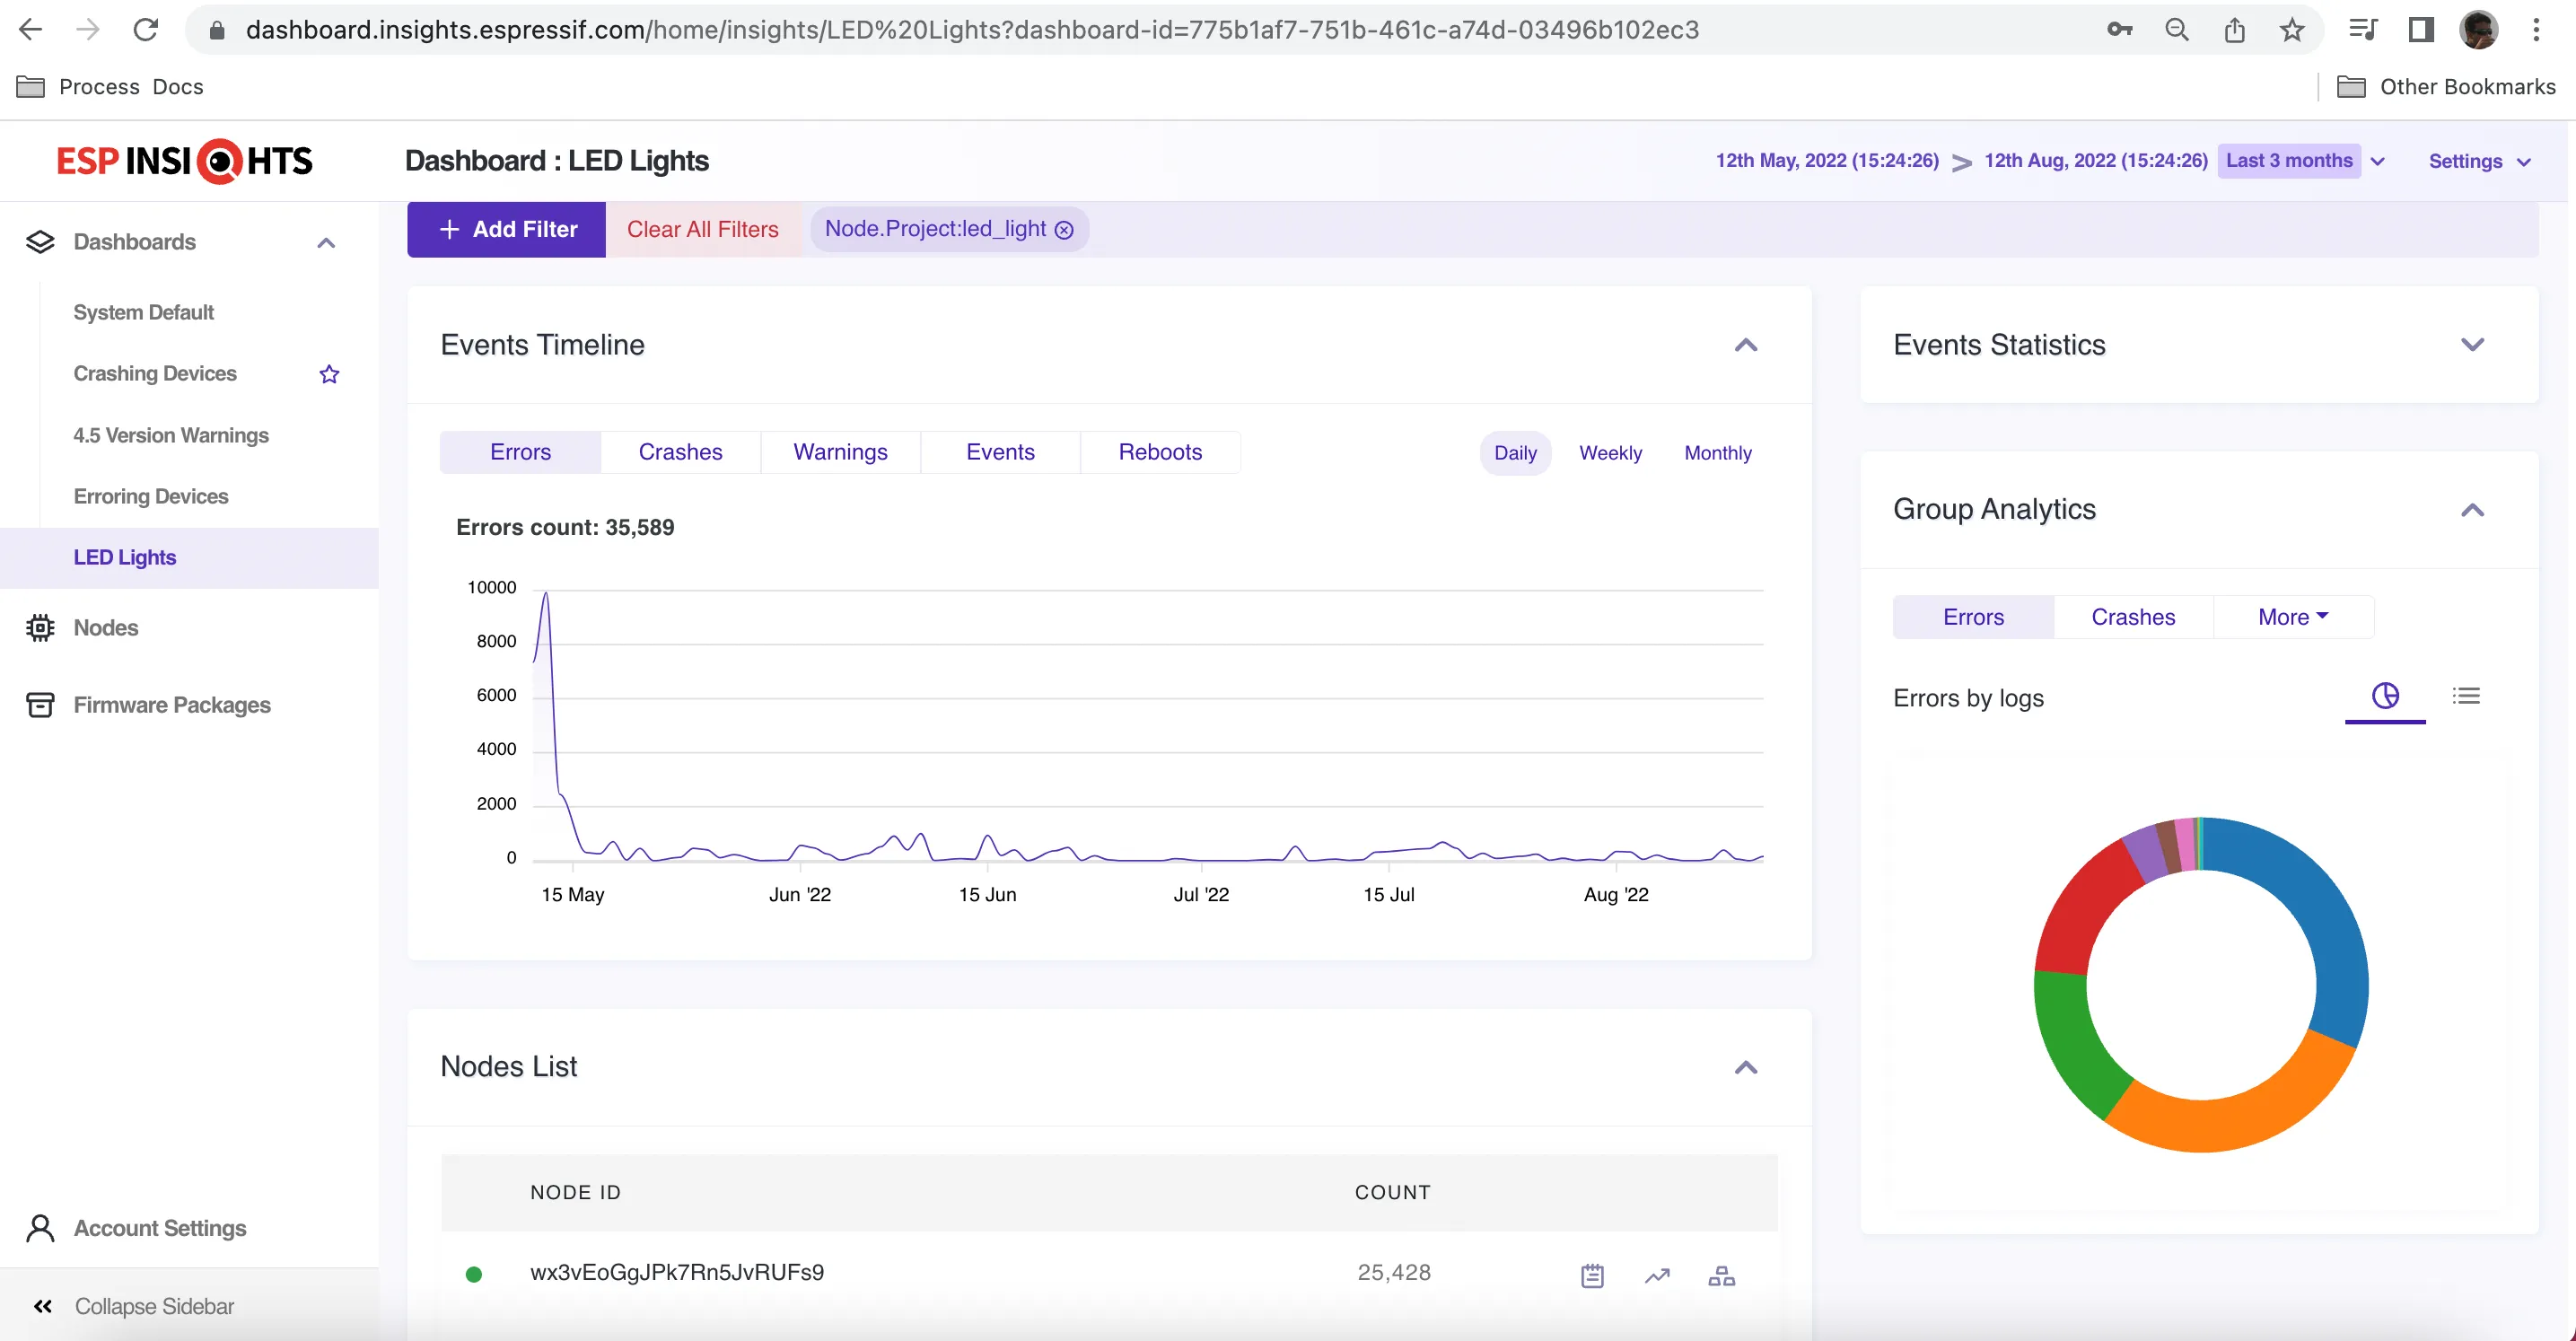
Users can add specific search filters, apply specific date range; either absolute or relative like last 30 days or last 7 days etc. The device list is updated based on the search criteria.
Let’s take a look at how the user can create and manage their dashboards.
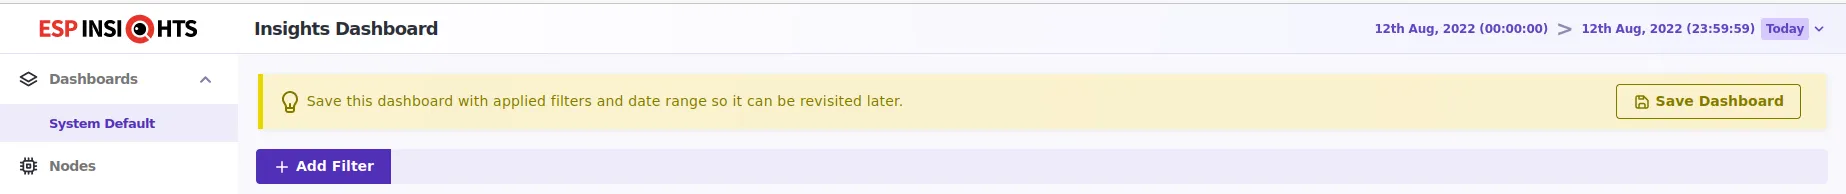
Initially there is only a default view, clean slate without any filters. The user can apply search filters, choose a date range and create a new dashboard. The users are prompted with a message if they want to save these filters as a separate dashboard. Click on the Save Dashboard should create a new Dashboard and should also get listed in the left side menu.
Based on the selected time range the data is loaded in the dashboard. If the selected date range is absolute (for e.g 10 June 2022– 10 July 2022), then same data as received during that time range will be loaded every time that dashboard is selected. If the time range is relative (for e.g. last 30 days), then the data for relative time (say last 30 days) from the current day is fetched and displayed in the selected dashboard.
2. Rename Dashboard
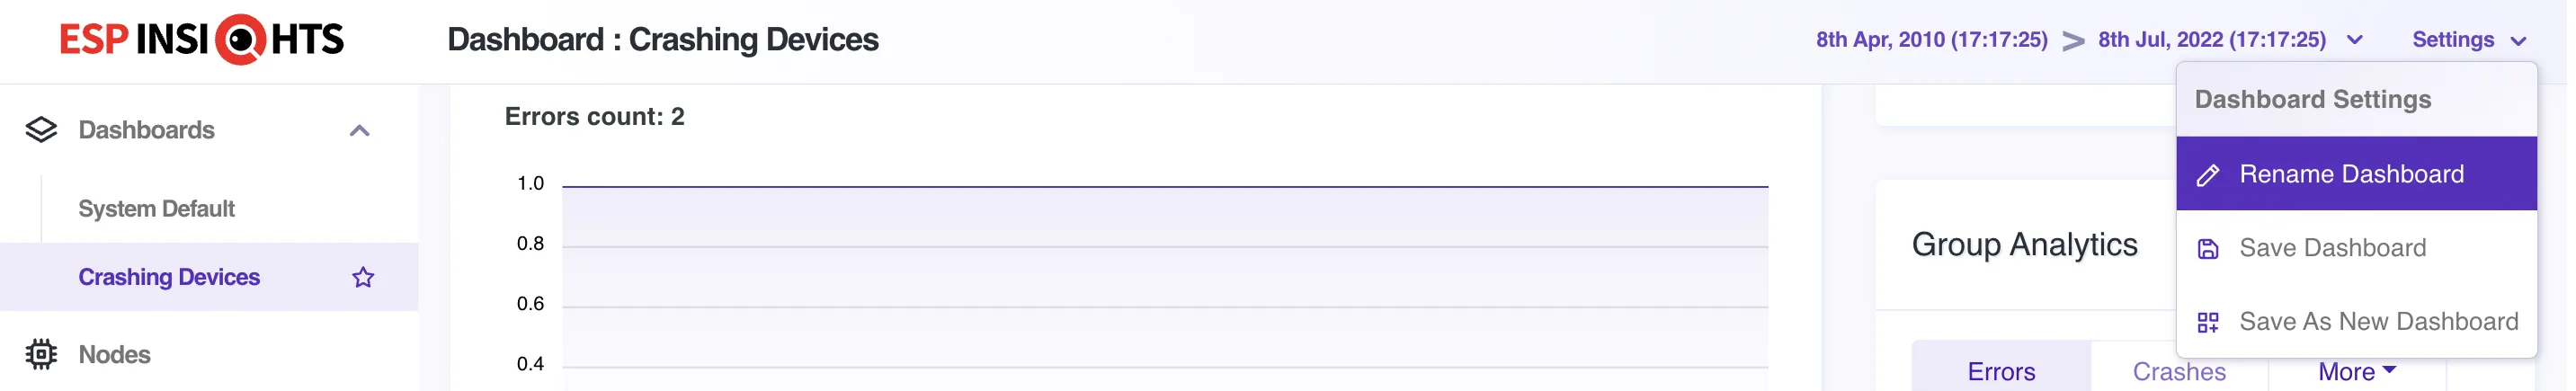
Once the dashboard is saved, the user has the ability to change the name of the dashboard to their liking. Click on the settings options in the top right corner of the dashboard and choose the option for Rename Dashboard
The name can be edited and the changes are saved. The same is reflected in the right side menu options as well as in the dashboard title.
3. Save Dashboard
Make any changes to the Dashboard filters or search criteria and the user has a provision to save the preferences. Once saved, these search criterion are persisted across the logins. Click on the settings options in the top right corner of the dashboard and choose the option for Save Dashboard
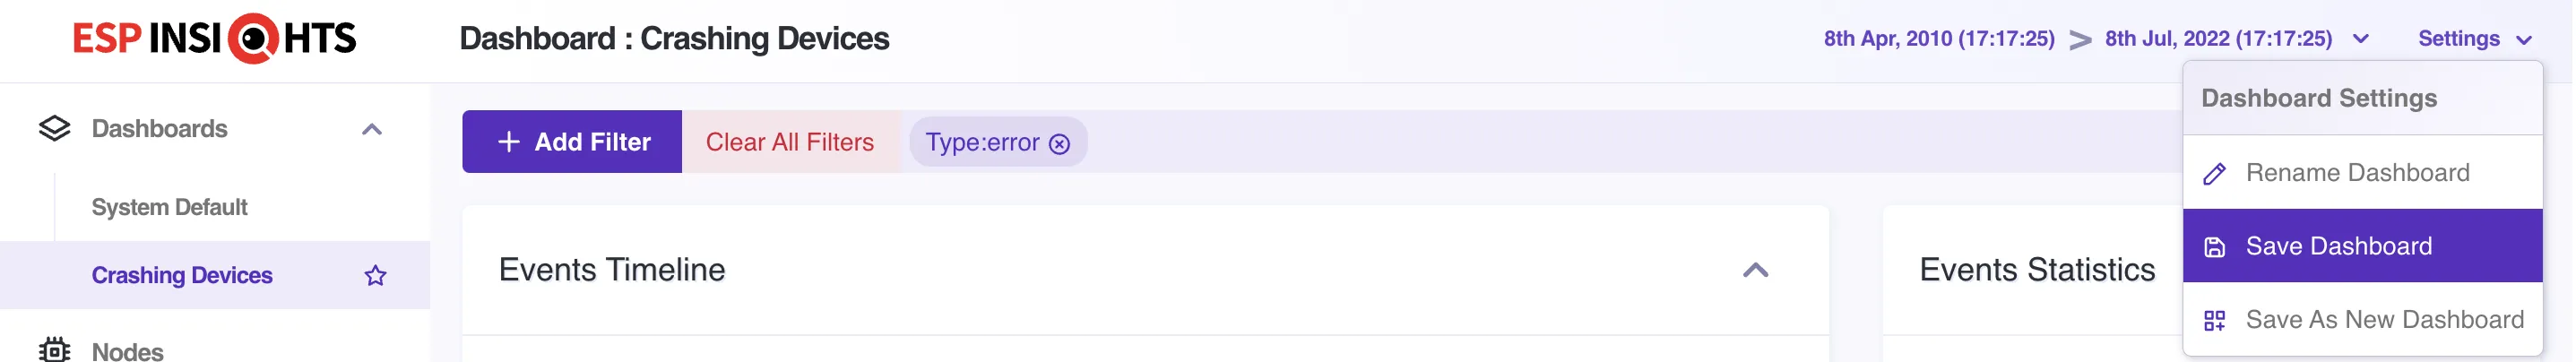
A confirmation message should appear once the changes to the Dashboard are saved successfully.
4. Save As New Dashboard
The user can create an altogether new dashboard from an existing dashboard as a template. Make changes to your existing dashboard, and user can save it as a new dashboard. The existing dashboard search filters are retained. Click on the settings options in the top right corner of the dashboard and choose the option for Save As New Dashboard.
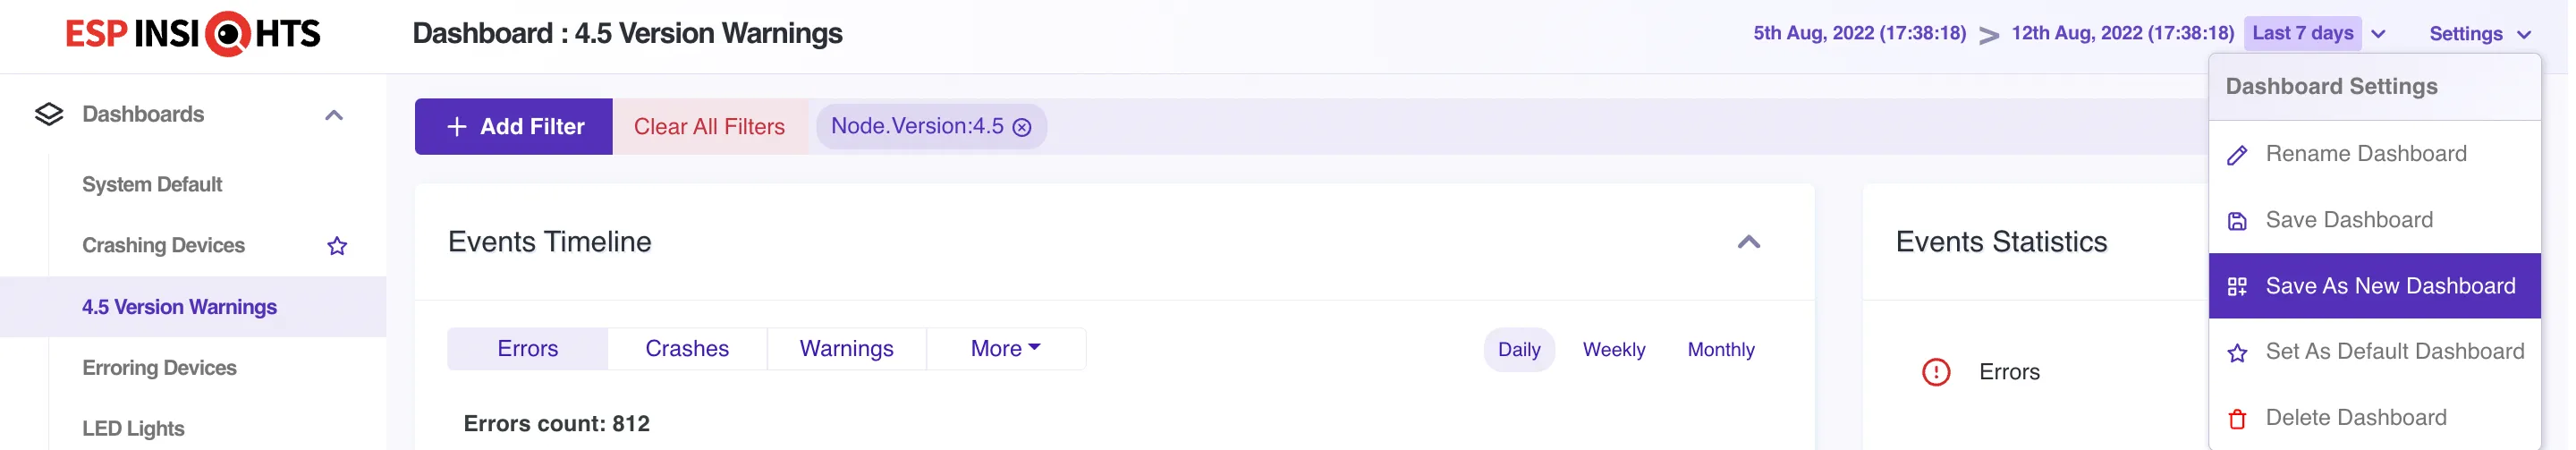
A new dashboard should get created and should be listed under the dashboards list on the left side menu.
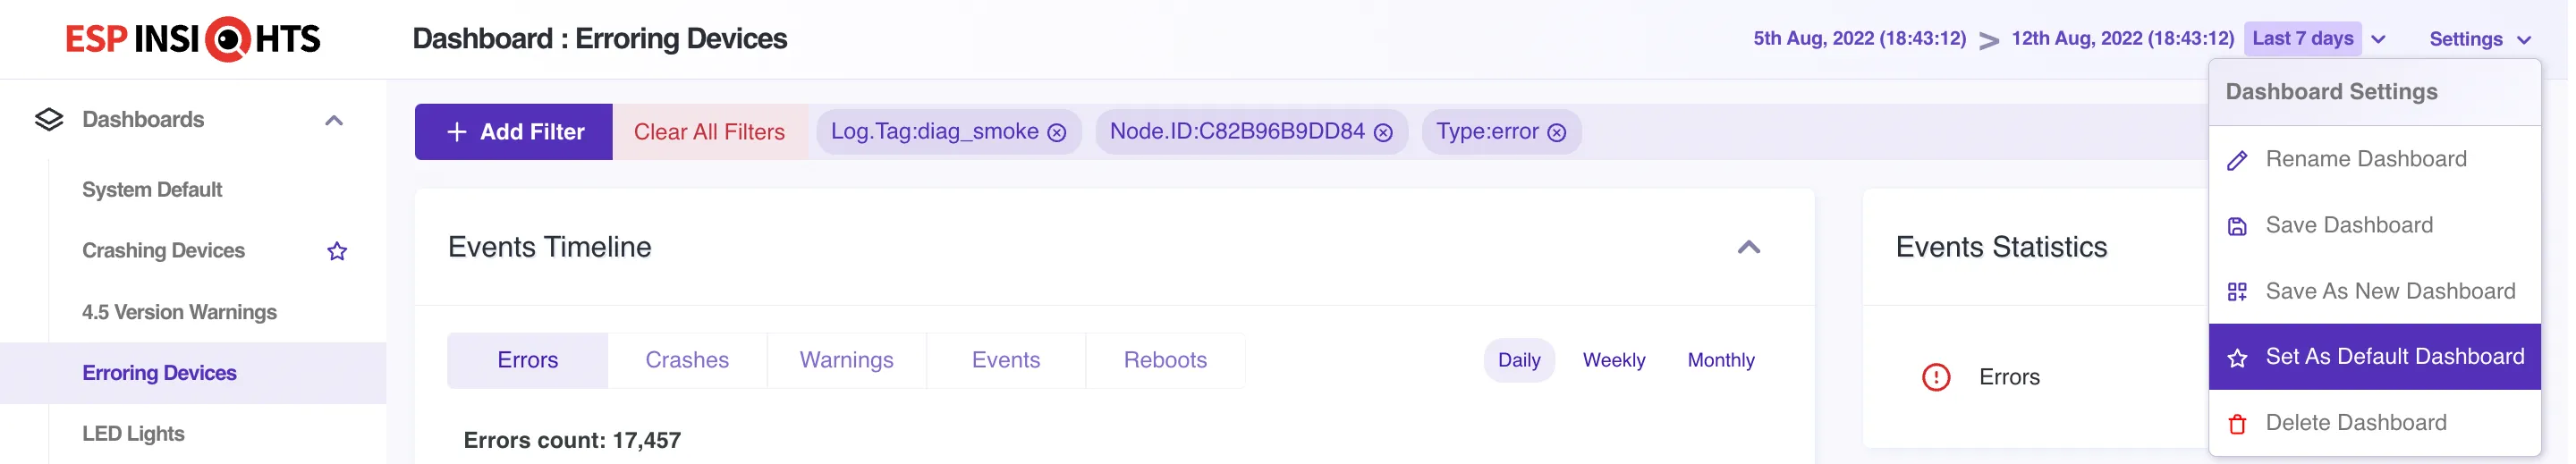
5. Set As Default Dashboard
The user can choose which dashboard should be the default landing page on login, sort of a favourite or the most frequently used one. Only one dashboard can be set as a default one. Click on the settings options in the top right corner of the dashboard and choose the option for Set As Default Dashboard.
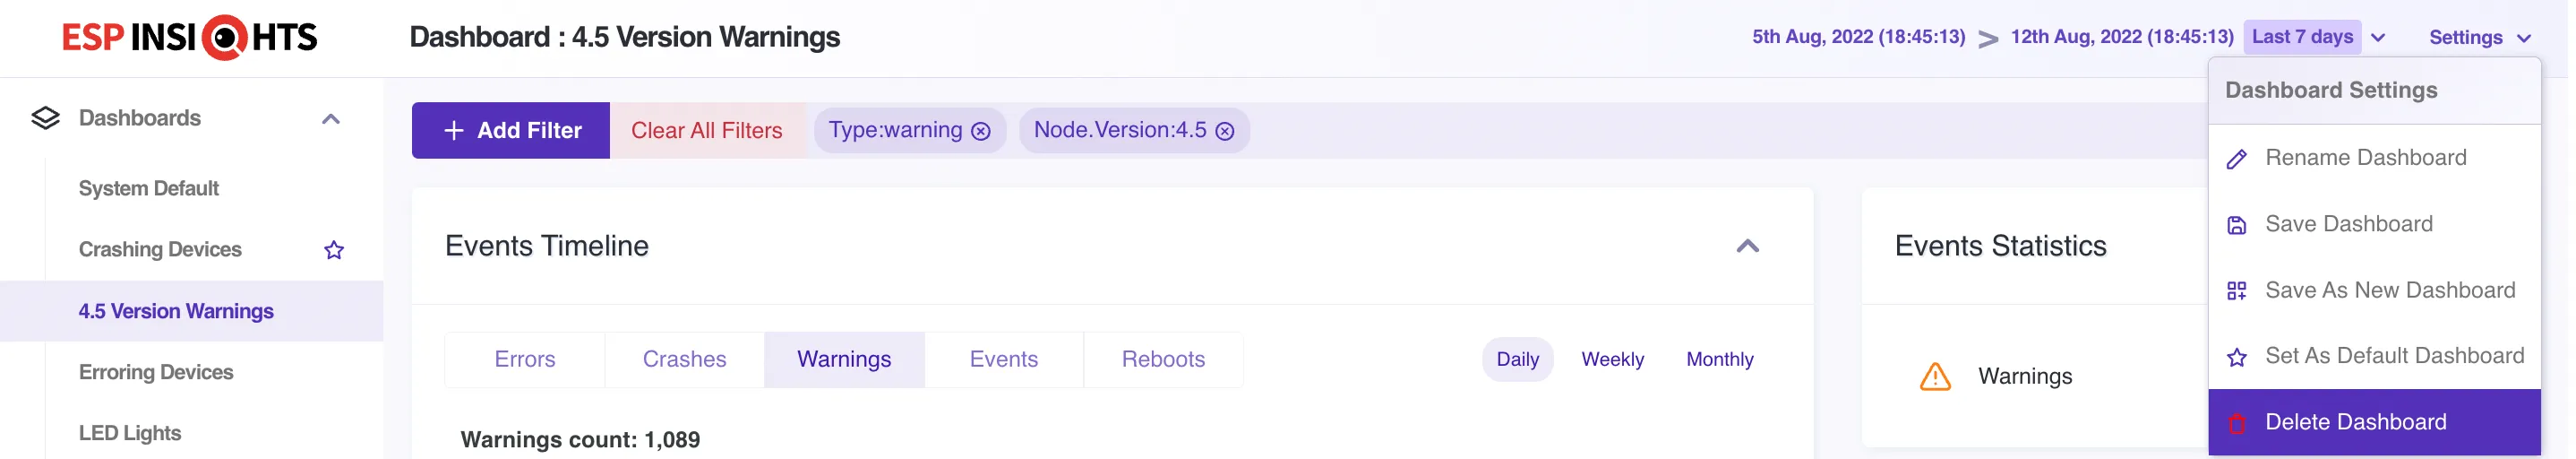
6. Delete Dashboard
The user can delete the dashboard which is no longer needed. Apart from the system default dashboard which sort of serves as the template, rest of the user created dashboards can be deleted one by one. Click on the settings options in the top right corner of the dashboard and choose the option for Delete Dashboard.
Try out this new feature on the https://dashboard.insights.espressif.com
We are working on some more exciting features in the ESP Insights, stay tuned to hear more!