
It’s been a few months, since we first introduced our Group Analytics feature in the ESP Insights. Group Analytics allows a wholistic view of your devices in the field, categorised or grouped either by their behavioural pattern viz. reporting certain type of crashes or reboots because of certain errors or even non-erroneous conditions. Devices could be even grouped at a very high level by their characteristics like the firmware application and the version they carry.
The first version of Group Analytics however provided a limited set of pre-defined grouping options. Refer to the blog for more details.
Dynamic Search Filters#
With lot of device data intelligence available for perusal, having pre-defined search filters and grouping options gave limited capabilities to the end users.
The new release for ESP Insights Dashboard, Group Analytics provides ability to search and group the devices on varied parameters. User is given an option to apply grouping filters on pretty much anything that is indexed and searchable in the database. Based on the selected filter type, suggestions for the search filter values are also made available. User can even filter for crash by particular register addresses or even crash backtrace address or log tags etc.
Multiple search filters can be applied in tandem as well to get more fine grained results. The most frequently used filters are listed at the beginning.
The filters types are available in a hierarchical fashion and are suggested as the user types in the input in the search filter text field.
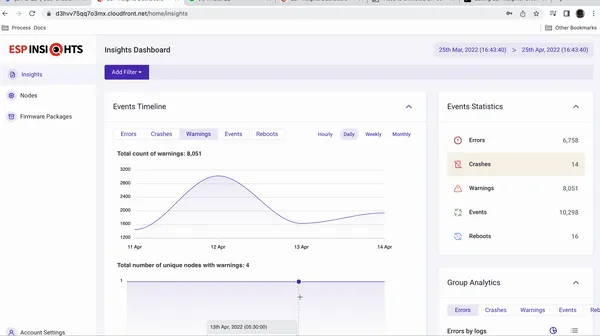
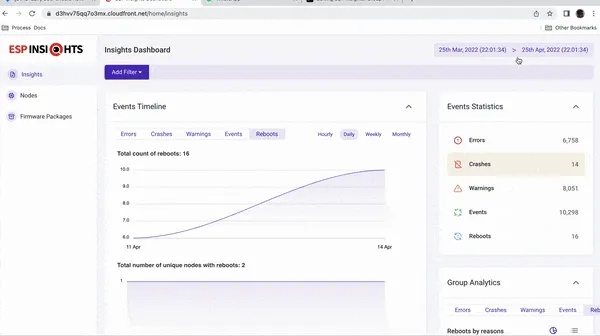
The event timeline has options to change the frequency of plotting to daily, weekly, monthly or even hourly.
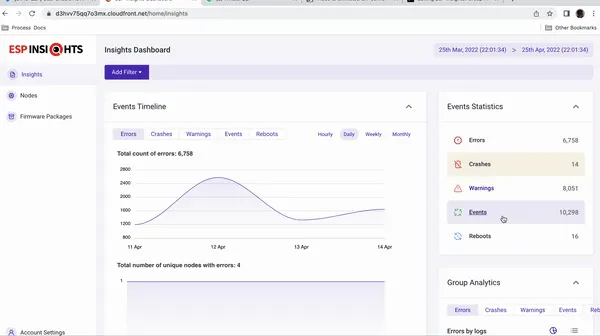
Compact Event Stats#
The event stats are displayed at one glance and are updated for the selected group search filter.
Vice versa, clicking on one of the items in the stats filter results in applying that particular event as search filter.
Each individual widget section can be collapsed or opened to focus on particular sections.
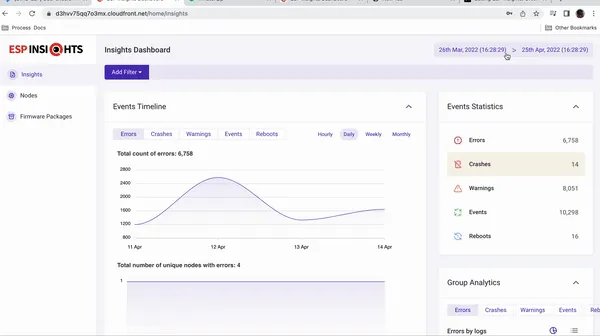
Rich Date and Time Range Selector#
New release of ESP Insights comes with a rich widget for Date and Time selector allowing user with a more fine grained control over time window to be used on this analytics page. The user is also provided with some default quick date filters like “Today”, “Yesterday”, “Last 24 hours”, “Last 7 days”, “Last 30 days” and “Last 3 months”. Custom date picker allows user to select time as well.
Node listing and Node Report Correlation#
Based on the search filters and grouping, the actual devices (nodes) are listed at the bottom. The listed nodes provide navigational links to move to individual node report for event logs, metrics and variable values for the selected node. The search filters like the event type and time window parameters are carried forward to the node report page automatically.
Try out the new Group Analytics and advanced searching capabilities by accessing on ESP Insights Dashboard.