
Espressif IDE is an Integrated Development Environment(IDE) based on Eclipse CDT for developing IoT Applications from end to end using the ESP-IDF(IoT Development Framework). It’s a standalone, customized IDE built specifically for ESP-IDF. Espressif IDE comes with the latest IDF Eclipse plugins, essential Eclipse CDT plugins, OpenOCD Plugins, and other third-party plugins from the Eclipse platform to support building ESP-IDF applications.
Key features of Espressif IDE#
- Easy-to-use IDE built on Eclipse CDT environment
- Specifically built for ESP-IDF application development
- Integrated esp toolchain configuration for build
- Offers auto-configuration of the build environment variables
- Offers new project wizard and getting started ESP-IDF templates
- Advanced editing, compiling, and editing with syntax coloring features
- Pre-built function header and function definition navigation
- Offers to install a new ESP-IDF or configure an existing one
- ESP-IDF Tools installation and configuration directly from IDE
- SDK Configuration editor for project-specific settings
- Integrated CMake Editor for editing CMake files such as CMakeLists.txt
- CMake based build support
- Support for UART and JTAG flashing
- Customized ESP-IDF OpenOCD Debugging with pre-built configuration and settings
- GDB Hardware debugging support
- Integrated ESP-IDF serial monitor for viewing program serial output
- ESP-IDF Terminal with the pre-configured build environment variables
- Application size analysis editor for analyzing static memory footprint of your application
- Supports Heap profiling for memory analysis and finding memory leaks
- Supports GDB Stub debugging on panic mode
- Provides Application level tracing for analyzing program behavior using start and stop commands
- Supports ESP32, ESP32-S2, ESP32-S3 and ESP32-C3 chips
- English and Chinese language support for IDE
- Extensible IDE for other third-party plugins from Eclipse eco-system
- Host operating systems supported: Windows, macOS, and Linux
What’s new with the v2.4.0 release?#
With our recent release of v2.4.0/2.4.1, we have released a bunch of new features, enhancements, and notable bug fixes which greatly improve the quality of the plugin also improve user productivity!
Source code navigation and linking esp-idf components#
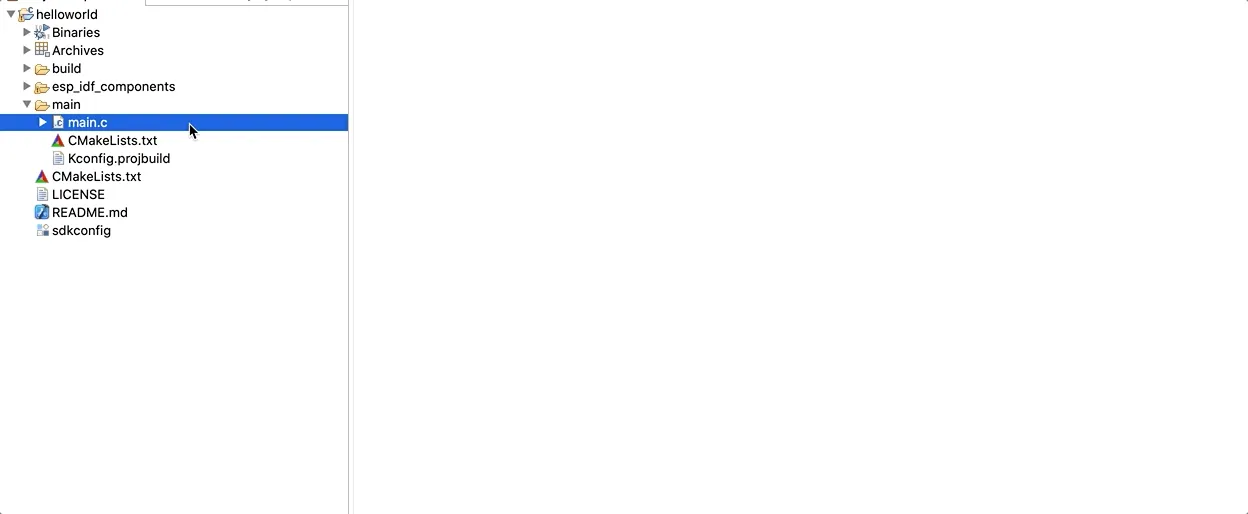
IDE offers integrated esp-idf components as part of the projects. When an IDF project is built all the dependent esp-idf components (based on the compile_commands.json) will be linked to the project with folder name esp_idf_components.
This will help in two ways. First, the user should be able to browse through the esp-idf source code directly under the eclipse project explorer. Second, It allows navigating to the function definitions by pressing F3 or ctrl+ click(in macOS command+click) on the function name.
Indexer Improvements#
One of the challenging issue with the IDE was unresolved headers and indexer problems. Though the project was able to build successfully the eclipse plugin was used to show errors in the source code editors. With the v2.4.0 release, we have optimized the indexer to find the headers based on the compile_commands.json defined components and resolve the functions.
As soon as the build finishes, the plugin will trigger linking esp-idf components and indexing all the files listed in it. This might take a couple of seconds based on the host system. These files located in the *esp_idf_components *folder are linked virtually to the esp-idf components folder and this list is refreshed every time after the build.
Application level tracing#
ESP-IDF provides a useful feature for program behavior analysis called Application Level Tracing. IDE has UI, that allows using start, stop tracing commands and process received data. To familiarize yourself with this library, you can use the app_trace_to_host project.
Before you start using application-level tracing, it is important to create a debug configuration for the project where you must select the board you are using in order to successfully start the OpenOCD server.
After debug configuration is created, right-click on the project in the project explorer and click on ESP-IDF: Application Level Tracing
It can take a while to open the application level tracing dialog because the OpenOCD server starts first, so you don’t need to start it externally. At the very top of the application-level trace dialog, there are auto-configured fields that you can change for the trace start command.
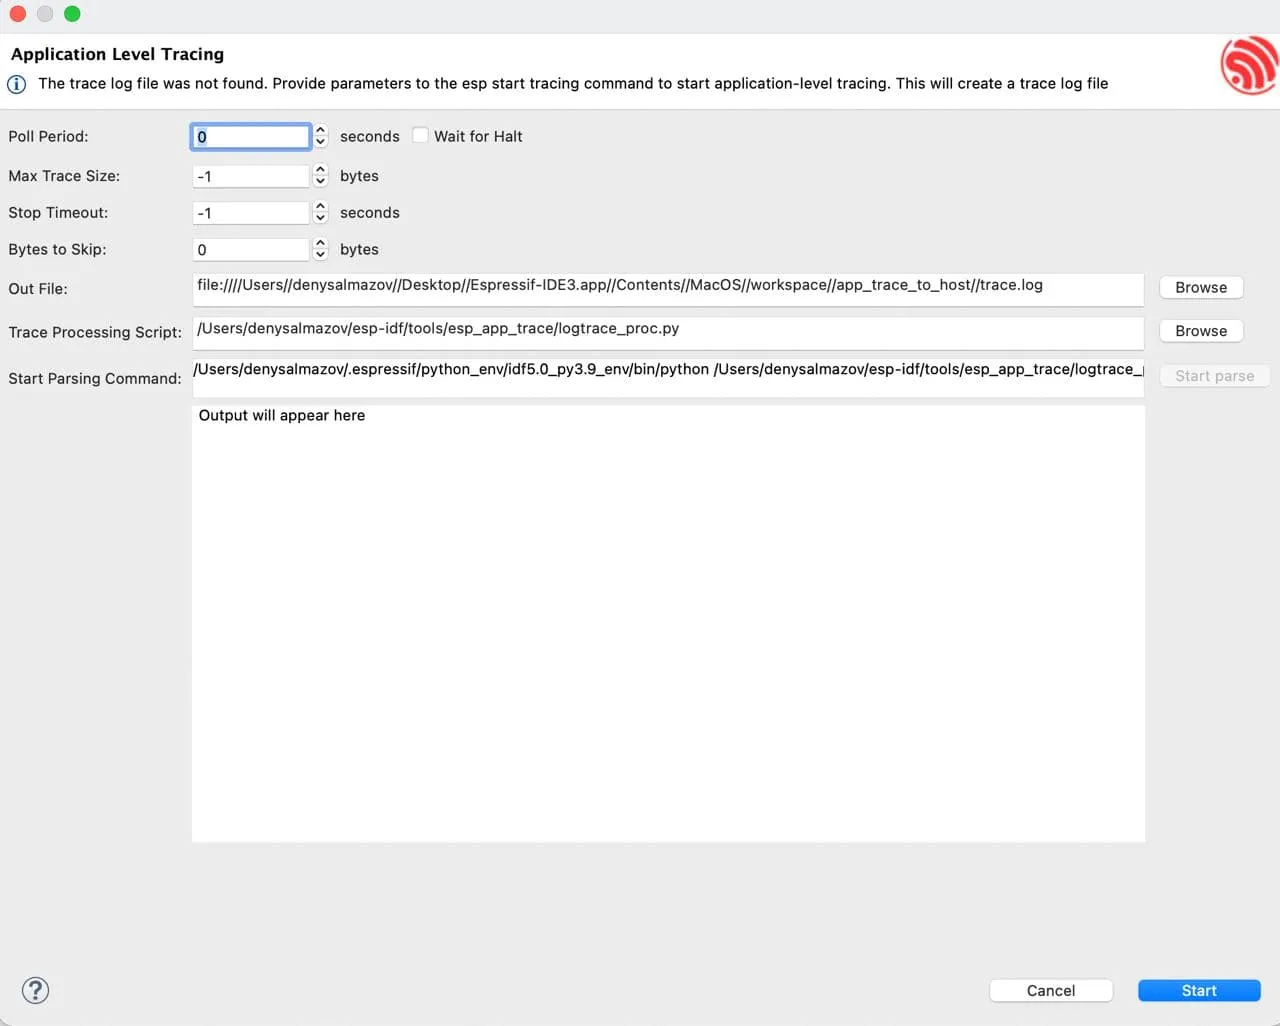
Trace Processing Script and Start Parsing Command are used to parse the output file. The first one is used to provide the path to the parsing script, by default it is logtrace_proc.py from esp-idf. In the second field, you can check the resulting parsing command and edit it if it’s necessary. By default, this field is automatically configured to match $IDF_PATH/tools/esp_app_trace/logtrace_proc.py/path/to/trace/file/path/to/program/elf/file.
The Start parse button is disabled until a dump file is available. To generate it, click the Start button at the bottom of the dialog box. After you click, the button changes to Stop so that you can stop tracking.
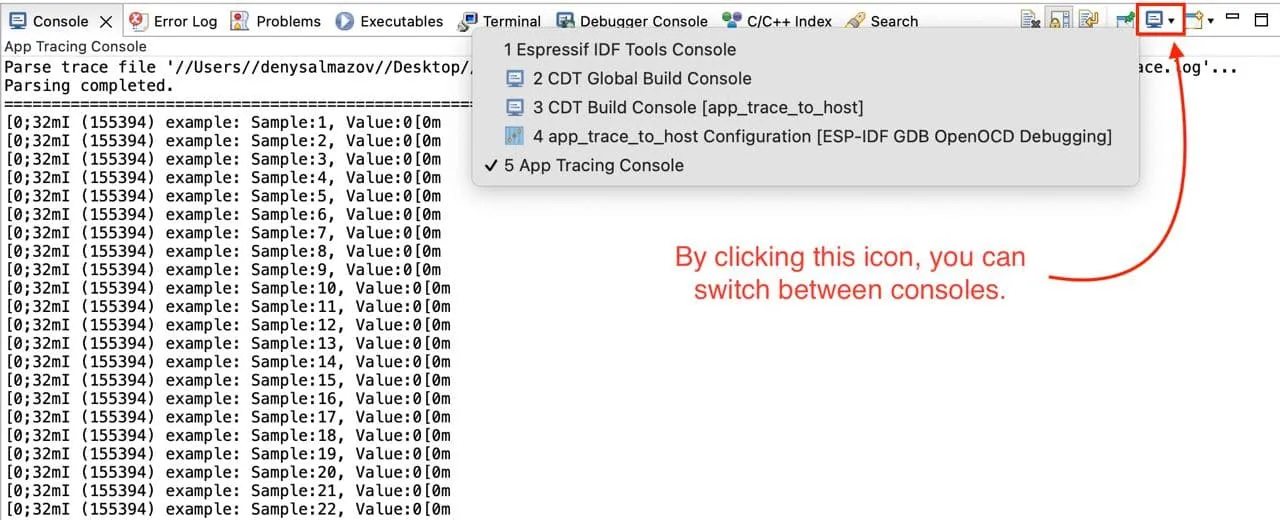
When the output file is generated, you can click on the Start parse button and you will see parse script output in the eclipse console.
Additional information can be found here.
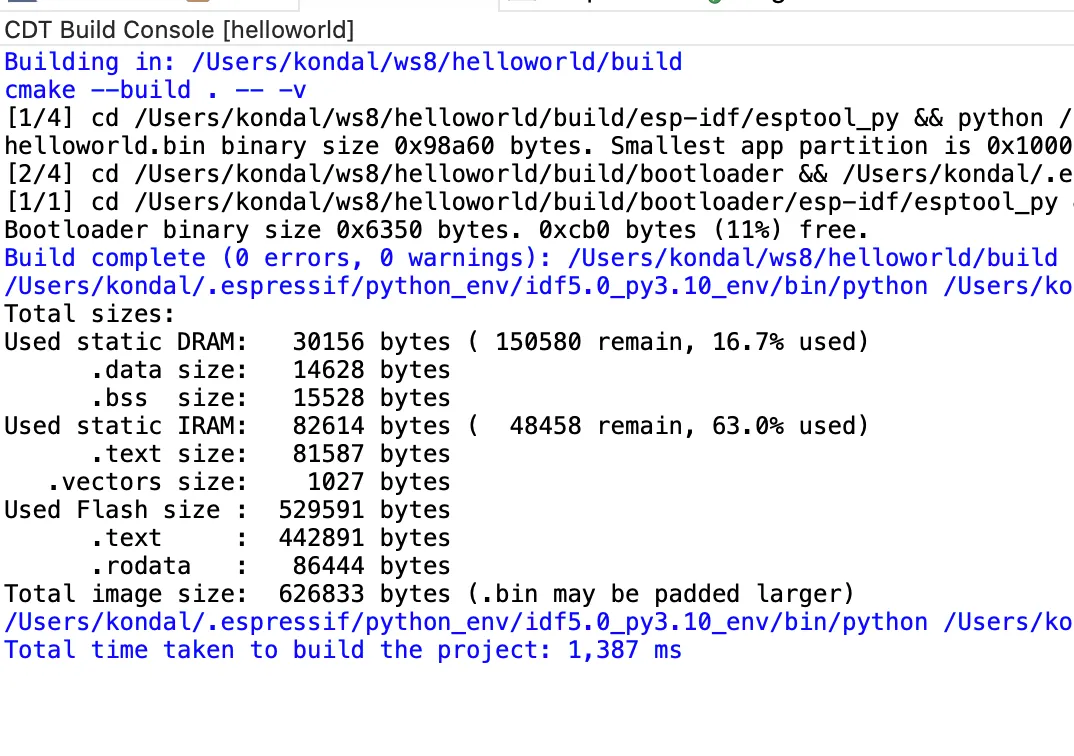
Application memory usage in the build console#
Keeping track of memory usage is an important aspect of IoT applications. Now after the build, you should be able to see the application RAM and flash usage information.
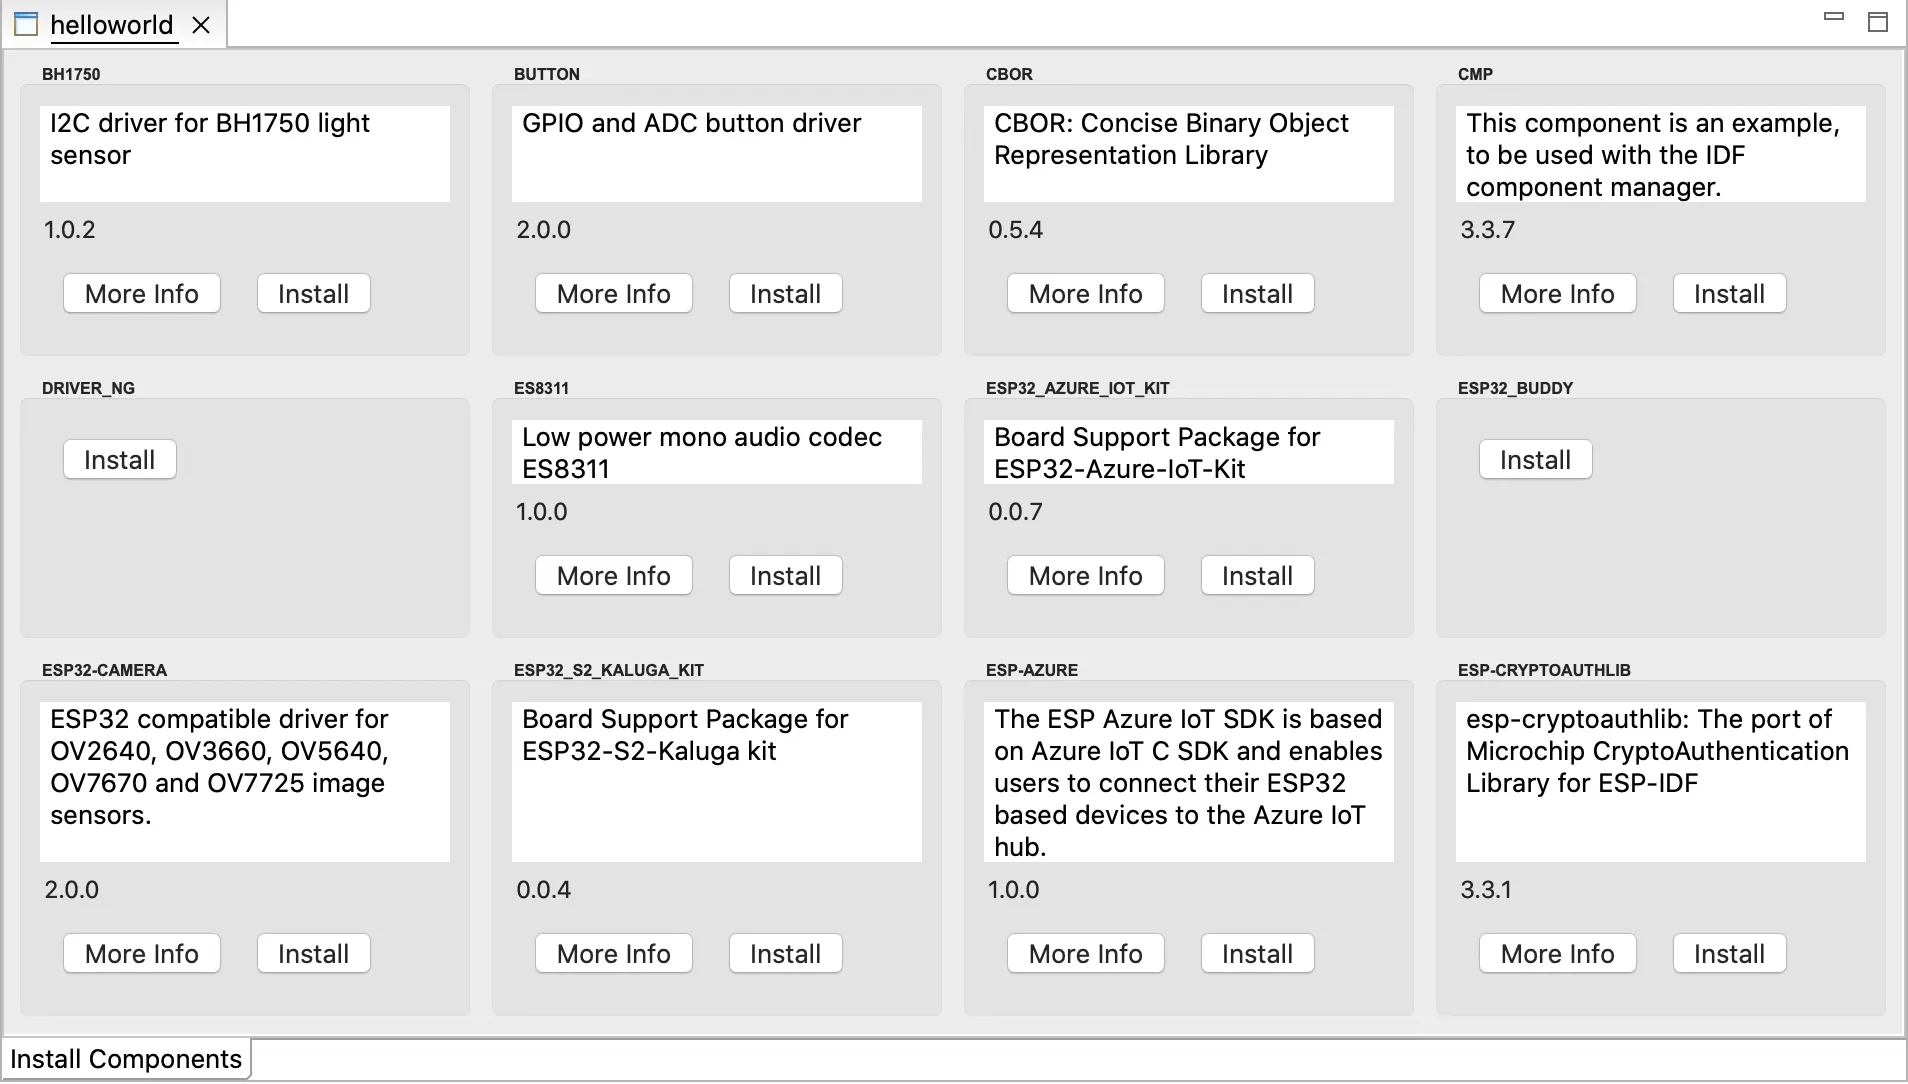
ESP-IDF Components Registry#
IDE offers to browse and install esp-idf components from the IDF registry and allows you to integrate them into your existing ESP-IDF project.
Right-click on the project from project explorer in which you want to add the component to and Select Install ESP-IDF Components, this will show up all the available components in the UI.
From the window, you can click on the Install button to add that component to the project. To get to the readme file for that component you can click on More Info which will open the browser link to the readme file of that component.
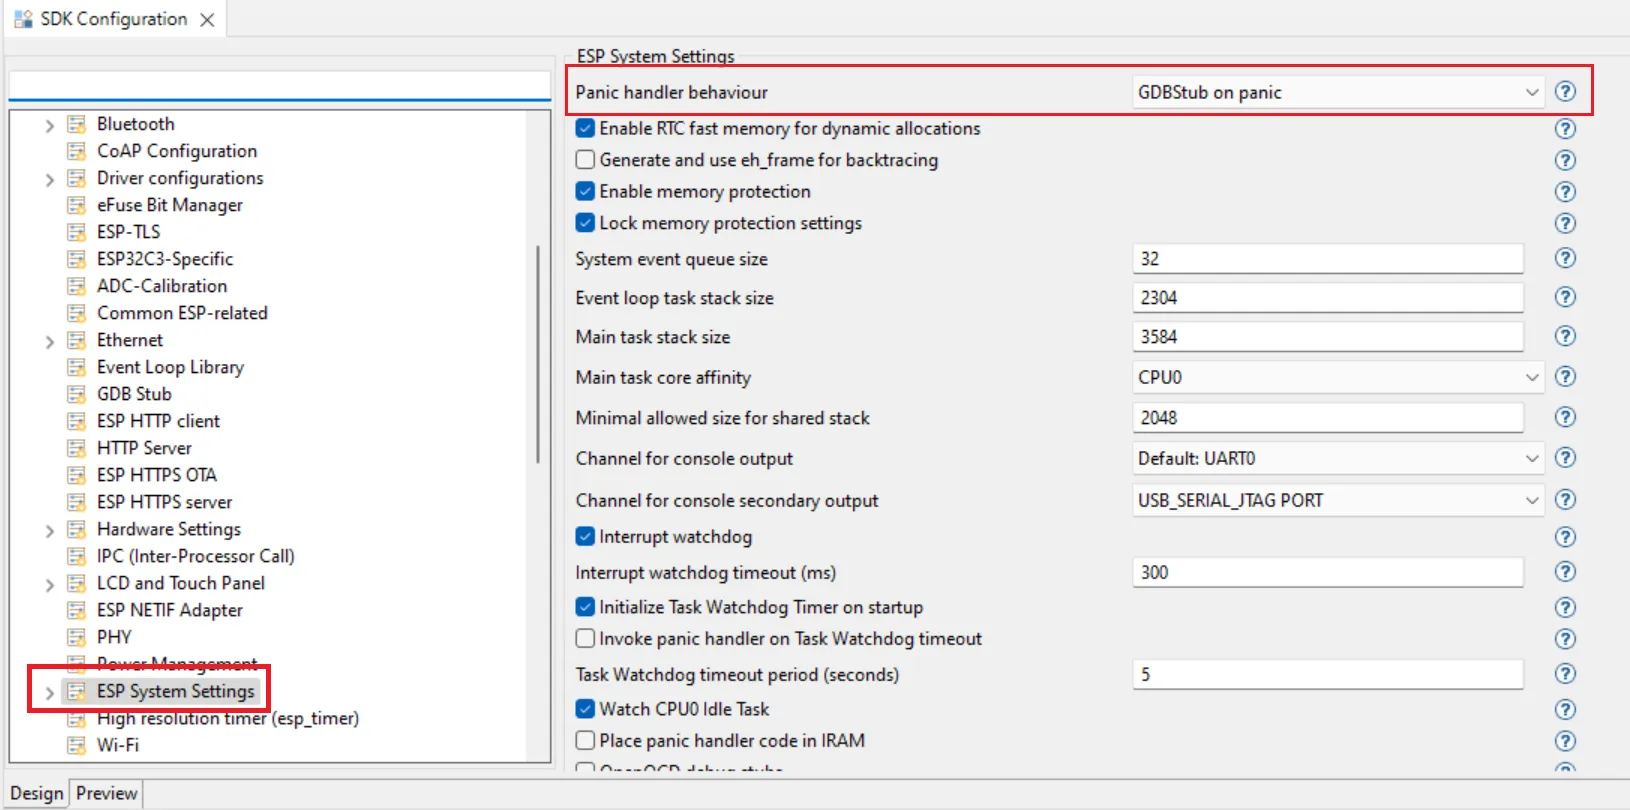
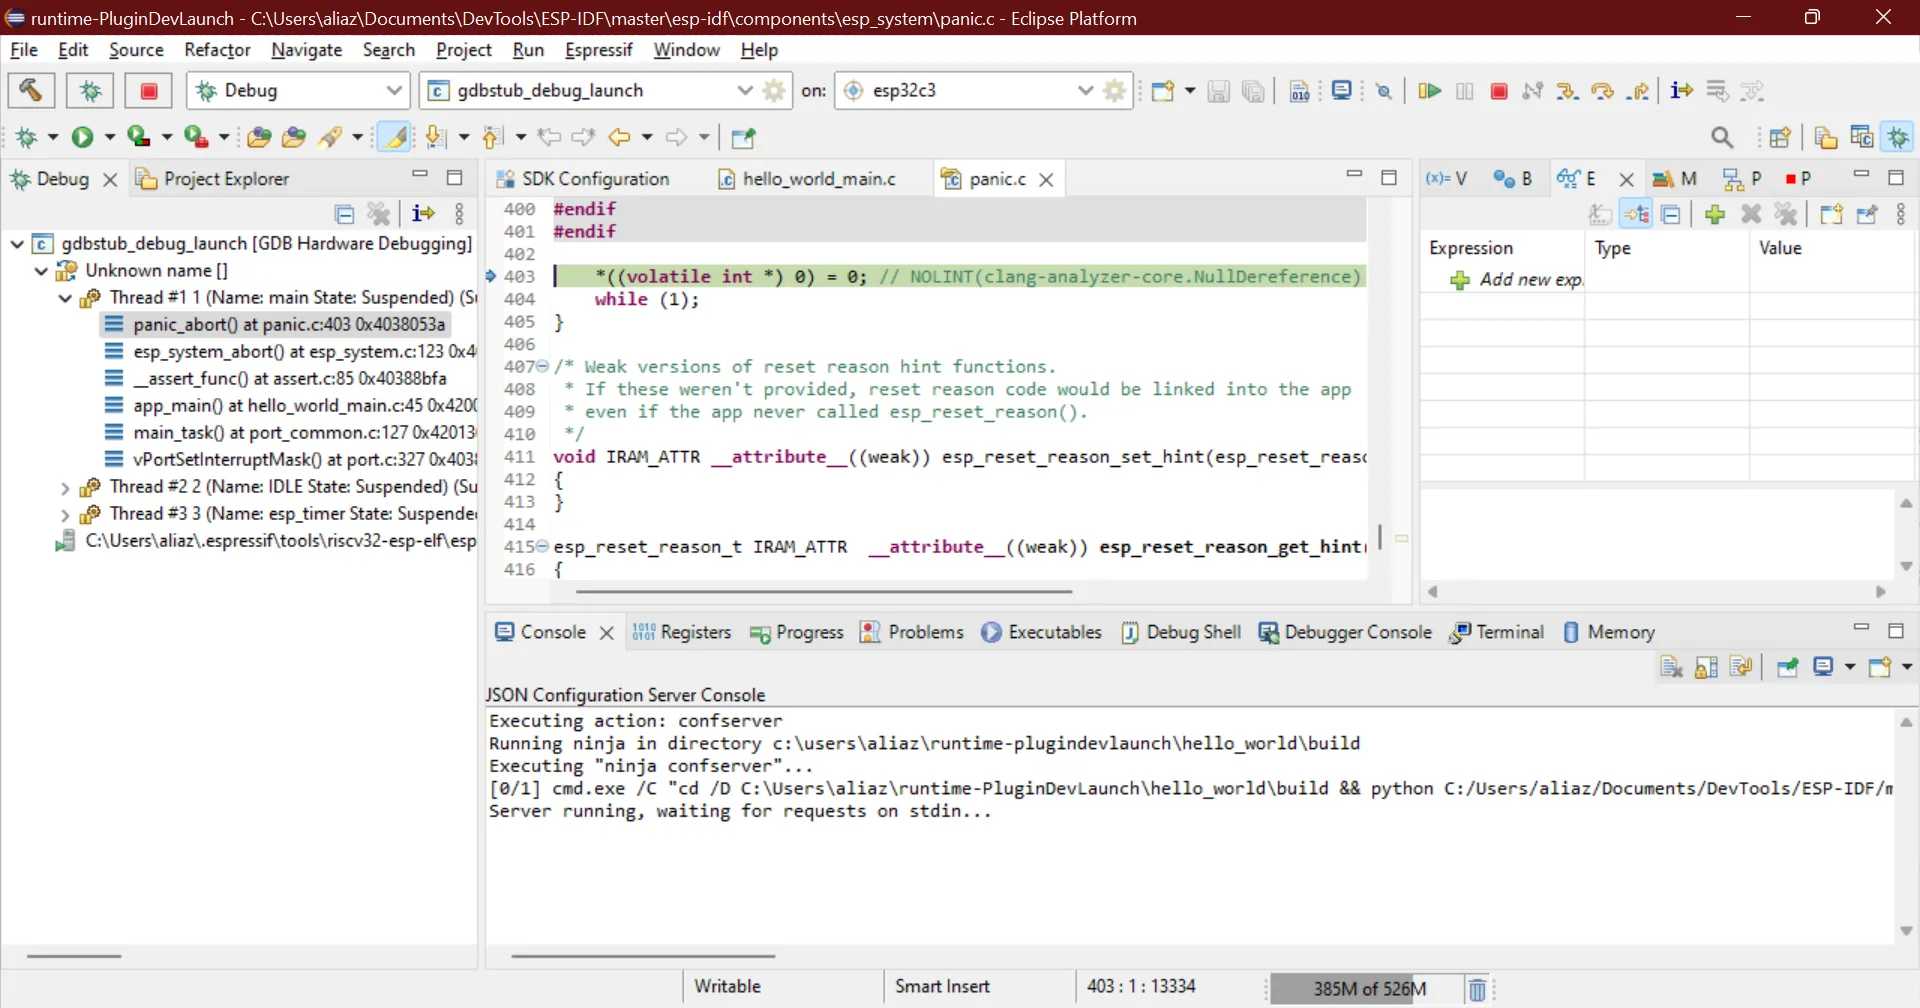
GDBStub Debugging#
IDE offers to diagnose and debug esp-idf applications using GDBStub debugging on-chip when it’s in panic mode.
To enable GDBStub debugging for a project you need to enable it first in the sdkconfig. Launch the sdkconfig in project root by double-clicking on it which will open the configuration editor. Expand the Component Config section and select ESP System Settings. From the settings on the right for Panic Handler behavior select the GDBStub on Panic option from the list
Now you will be taken to the GDBStub debugger automatically when you connect the serial monitor and there is a panic for this example create a template hello_world project and add the following lines in the main c file.
This is a global variable* COREDUMP_DRAM_ATTR uint8_t global_var;*
Now add these two lines just above esp_restart() function global_var = 25; assert(0);
The final file should be something like this.
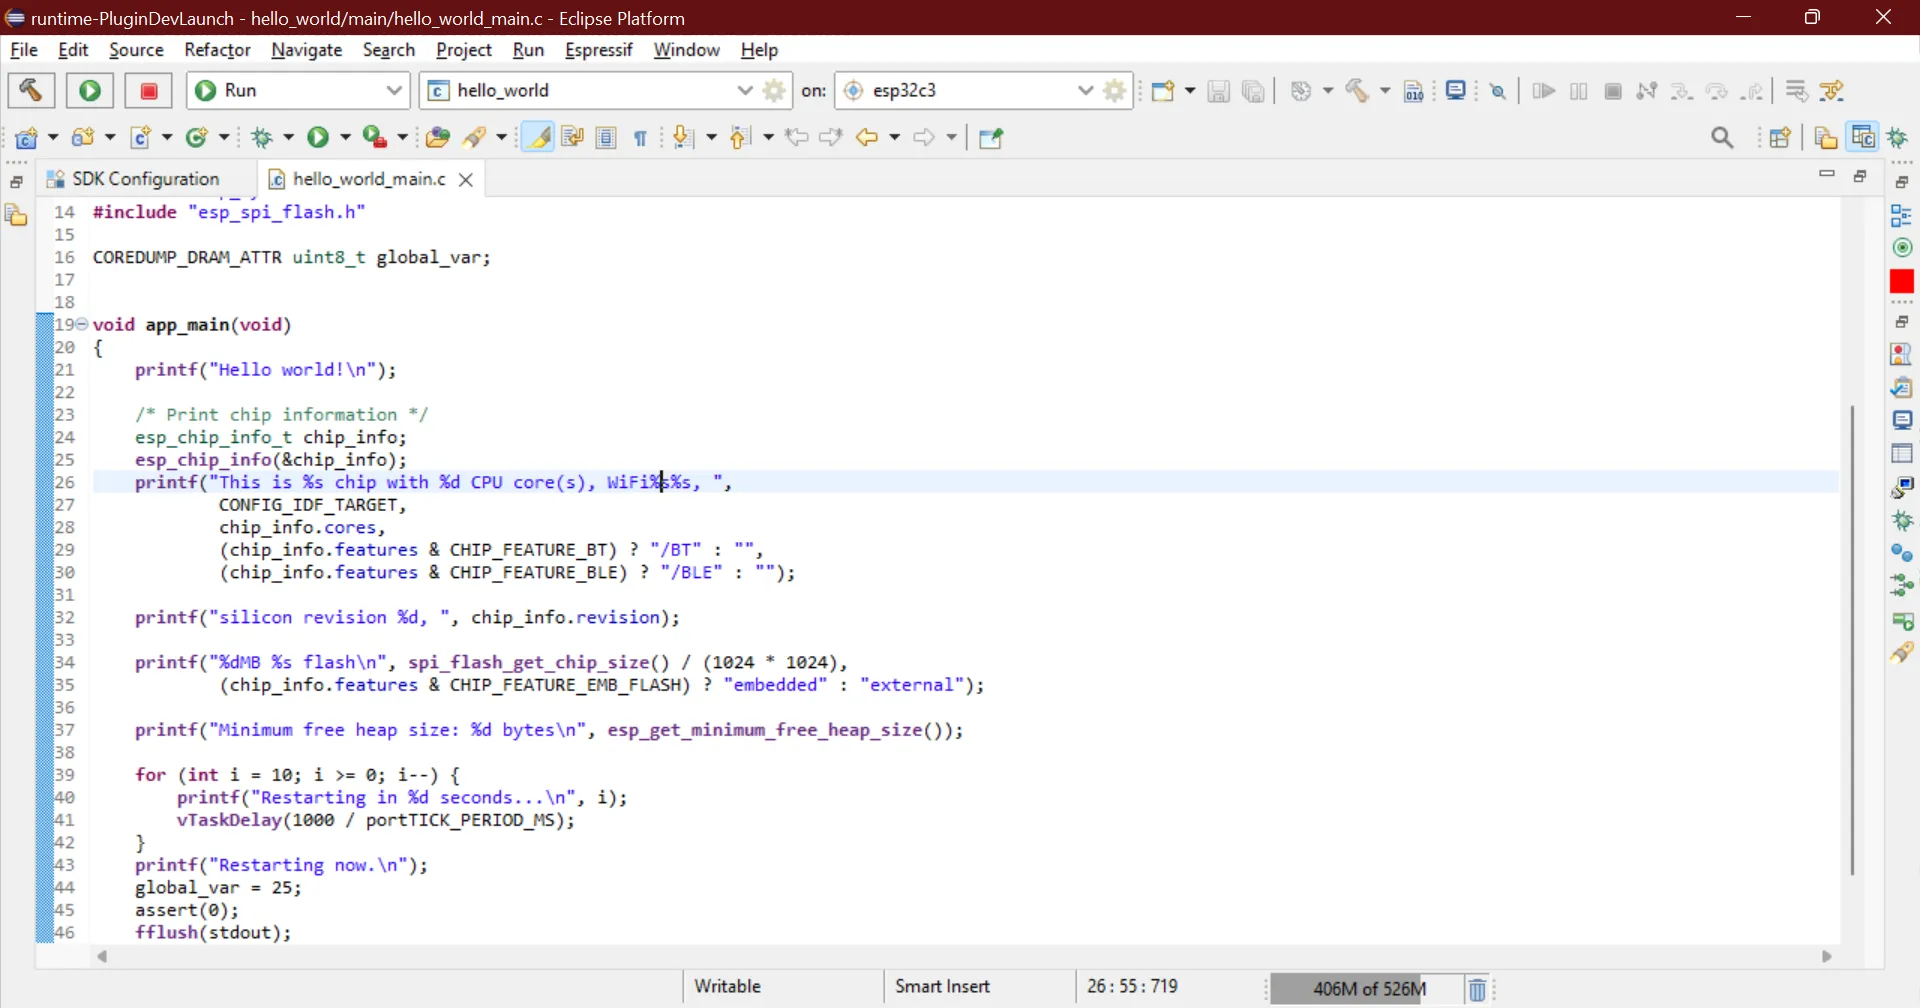
Build and flash the project and launch the serial monitor. On line number 45 we are signaling for a failing assert which will put the chip in panic mode and when that line reaches you will be prompted to switch the perspective to debug mode and the chip will be halted, remember that this is a panic mode and you cannot continue the execution from here you will have to stop and restart the chip through IDF commands or simply restart the serial monitor.
You can view the registers stack trace and even view the value of variables in the stack frame. To exit the debug session simply press the stop button.
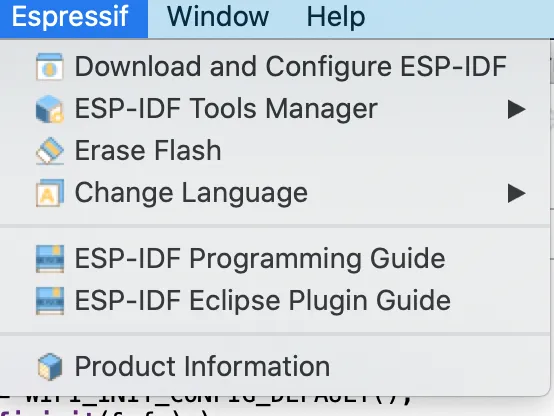
Espressif Menu#
All the plugin contributed menu items are moved into the Espressif Menu and this will improve the user experience and easy accessibility!
Eclipse 2021–12 Support#
IDF Eclipse plugin supports the latest version of Eclipse 2021–12(4.22) along with the Eclipse 2021–09 and Eclipse 2021–06.
There are many other improvements and bug fixes that are part of the v2.4.0 release. Please check our v2.4.0 and v2.4.1 release pages for more details.