Blog
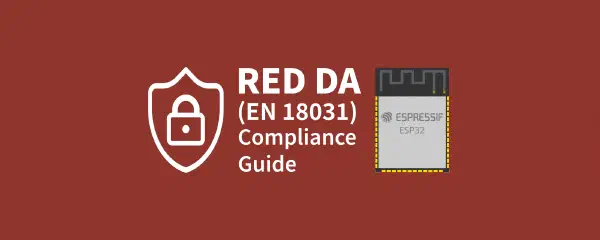
RED DA (EN 18031) Certification Compliance: What You Need to Know
This guide helps manufacturers of wireless-enabled products based on Espressif modules understand the RED DA (EN 18031) cybersecurity requirements, identify their product’s category, and determine the right path to certification before launching in the EU market.
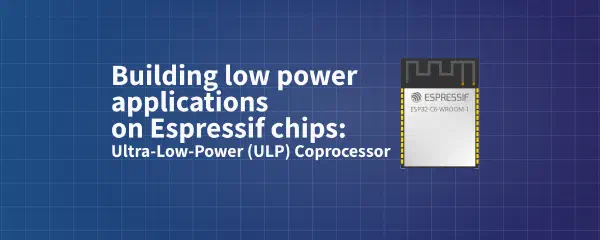
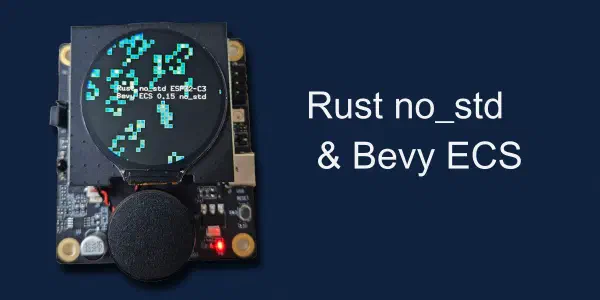
Building low power applications on Espressif chips: Ultra-Low-Power (ULP) coprocessor
In this article, we’ll start with a quick overview of Ultra Low Power coprocessors (ULPs) in Espressif chips and how they can significantly reduce power consumption in your applications. Then, we’ll walk through a tutorial on how to use ULPs in practice!
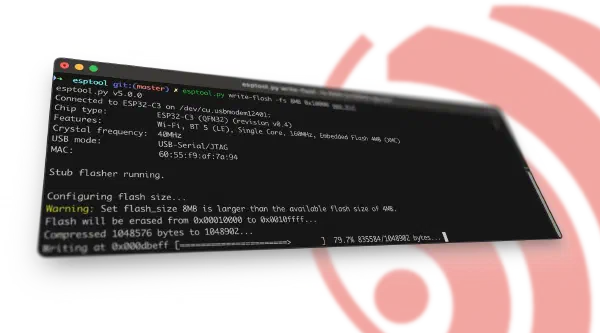
esptool: Updates about the upcoming v5 major release
esptool v5, currently under development by Espressif, boosts its new public API and customizable logging capabilities for developers. The new version brings enhancements for users as well. Contributions are welcome, preview out now.

ESP-Knob: A multifunctional smart controller with the ESP32-H2
This article provides an overview of the ESP-Knob, its features, and functionality. It also details the hardware design and outlines the firmware framework that supports its operation.
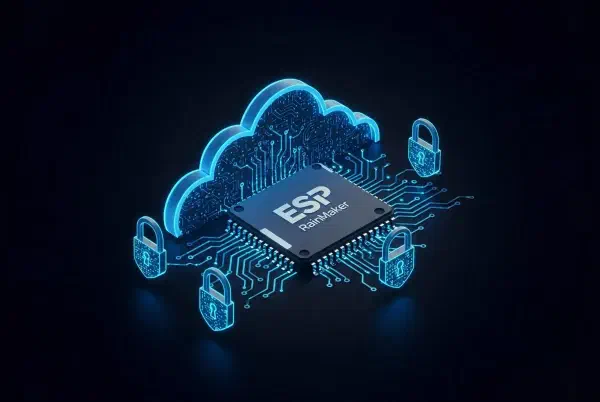
Security in ESP RainMaker
·8 mins
This article provides a high level overview of the security architecture of the ESP RainMaker IoT platform, covering all aspects like device hardware and network security, client network security, authentication and access control, user-device mapping, cloud data security and certifications.

ESP32-H2 Upgrade: Enhanced Security and Protection
·2 mins
Espressif has released ESP32-H2 v1.2, bringing significant cryptographic and hardware security improvements.


Introduction to Zephyr OS Tracing and Profiling
This is an introduction to the critical embedded system debugging techniques of tracing and profiling within the Zephyr RTOS. After reading this article, you can use Zephyr’s native tracing tools to gain a visual, in-depth understanding of system dynamics, helping to evaluate performance, spot timing issues, and diagnose complex problems like memory leaks or thread interaction glitches.