Introduction#
ESP-IDF VS Code Extension v1.8.0 has been released! It introduces new features and many improvements. If you face any issue or improvement ideas please share them as a Github issue.
This article covers the following key features:
- Eclipse CDT GDB Debug Adapter
- ESP-IDF version switcher
- Code navigation without full project build
- ESP-IDF Hints viewer
For other updates please review v1.8.0 Release notes. Now let’s look into the key features one by one.
Eclipse CDT GDB Debug Adapter#
First, we will briefly talk about the implementation of debug adapters in VS Code and then will move on to the actual Eclipse CDT GDB Debug Adapter.
What is a debug adapter in VS Code?#
VS Code implements a generic (language-agnostic) Debugger UI that is based on an abstract protocol. That protocol was specifically introduced to communicate with debugger backends. As debuggers typically use their own long-established protocols, some “adapter” is needed to allow debugger UI to communicate with debugger backends. This is described in the debugging architecture of VS Code documentation.
This adapter is typically a standalone process with its own protocol. Both the Debug Adapter (DA) and the abstract protocol that is used between the VS Code’s Debugger UI and DA – the Debug Adapter Protocol (DAP) – have already been implemented by independent contributors. The diagram below illustrates it better:
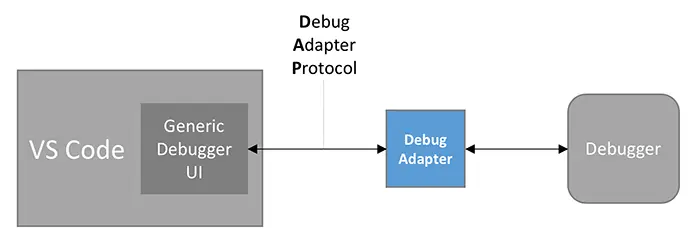
The image is borrowed from VS Code documentation.
The actual Eclipse CDT GDB Debug Adapter#
Up until this version, only ESP-IDF Debug Adapter implemented in python by Espressif has been available in ESP-IDF VS Code Extension. While it works, our users have reported many issues regarding configuration, responsiveness and runtime errors.
In search of a better solution, we chose the CDT GDB Adapter implemented by the Eclipse CDT Cloud team in TypeScript that uses NPM serialport package underneath. We only made a few minor updates to make it work with our tools. In our plugin, this adapter is called Eclipse CDT GDB Debug Adapter and is used in launch.json when configuration type is gdbtarget.
To use the Eclipse CDT GDB Adapter in an ESP-IDF project, add the following configuration in .vscode/launch.json:
{
  "configurations": [
    {
      "type": "gdbtarget",
      "request": "attach",
      "name": "Eclipse CDT GDB Adapter"
    }
  ]
}
To start debugging the project, do the following:
- Build (command palette: ESP-IDF: Build your Project)
- Flash (command palette: ESP-IDF: Flash your Project)
- In the
Runmenu, pressStart debugging.
You can also check how to use the new debugger by following the debug tutorial.
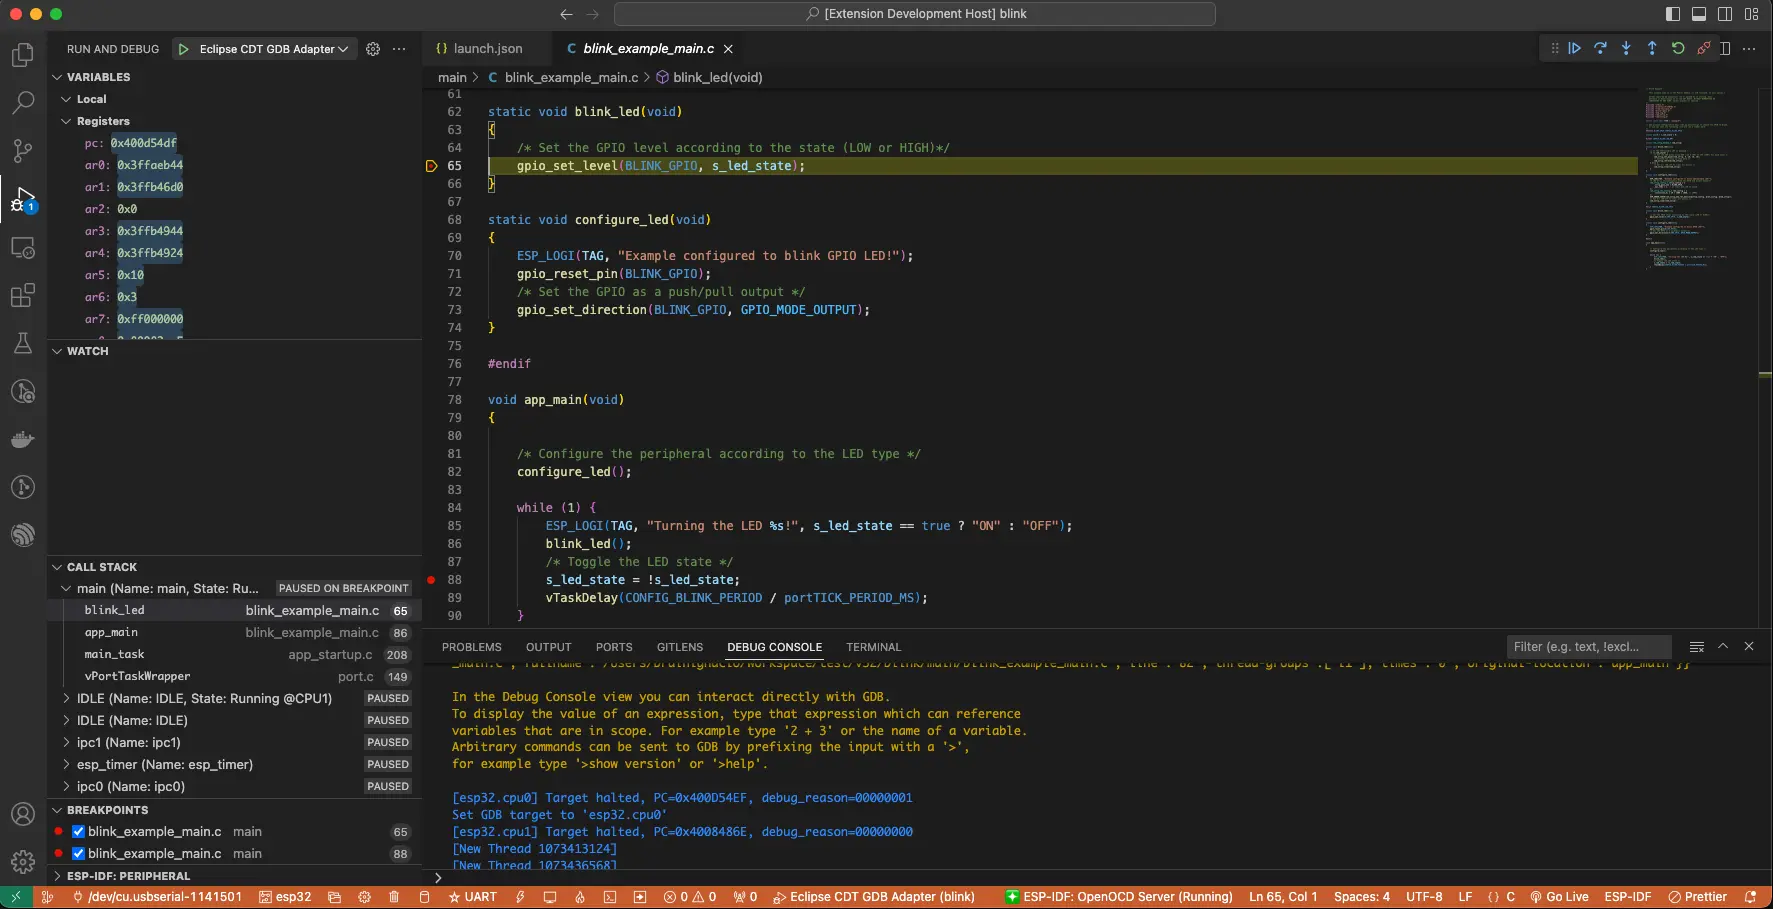
The following figure shows an active debug session with the Eclipse CDT GDB Debug Adapter in VS Code. You can see the list of variables, call stack, breakpoints, debug console and debug controls such as step in, step out, etc.
Advanced configuration of Eclipse CDT GDB Debug Adapter#
There are many configurable options to customize the debug adapter if desired. You can view a deeper description in the debugging documentation.
ESP-IDF version switcher#
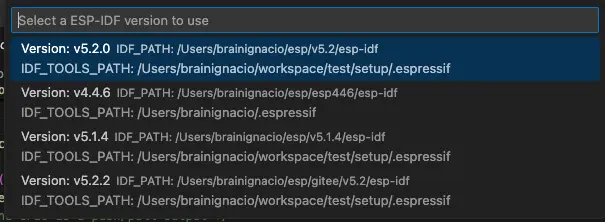
Whenever you install ESP-IDF in your system using the command ESP-IDF: Configure ESP-IDF Extension, the installations are saved in our extension as global state IDF setup. Now you can use ESP-IDF: Select Current ESP-IDF Version to set the ESP-IDF version you want to use in your current project (workspace folder in VS Code terminology). If you want to delete these IDF setups from the extension global state, you can use ESP-IDF: Clear Saved ESP-IDF Setups.
The current ESP-IDF version for currently open ESP-IDF project is shown in the status bar items like this:

Code navigation without full project build#
VS Code extensions for code navigation are dependent on a compile_commands.json file. Before this version, you could only generate such a file by fully building your project. Starting from this version, the file can be generated by running a dedicated command ESP-IDF: idf.py reconfigure task. It saves much time. Read on for more beginner-friendly explanation.
One of the key features of an IDE is code navigation. While working on your project, you usually want to benefit from such common language features as syntax highlight, code completion, go to definition/declaration, and others. For C/C++ language support, usually the extensions like C/C++ extension or clangd extension are used.
Such extensions usually rely on a compile_commands.json file – a JSON compilation database which consist of an array of command objects, where each command object specifies one way in which a translation unit is compiled in the project. More information about a JSON compilation database can be found here.
Now you can enable code navigation by using the command ESP-IDF: idf.py reconfigure task to generate a compile_commands.json file without the need to wait for the whole project to build. This command executes the ESP-IDF reconfigure task, hence its name.
ESP-IDF Hints viewer#
ESP-IDF will try to show hints to resolve errors as described in idf.py documentation. It works with a database of hints stored in tools/idf_py_actions/hints.yml and the hints will be printed if a match is found for the given error.
In the source code editor, errors that match a line will be shown when the user mouse is hovering that line.
The ESP-IDF bottom panel automatically updates to display ESP-IDF hints based on the errors in your currently opened file.
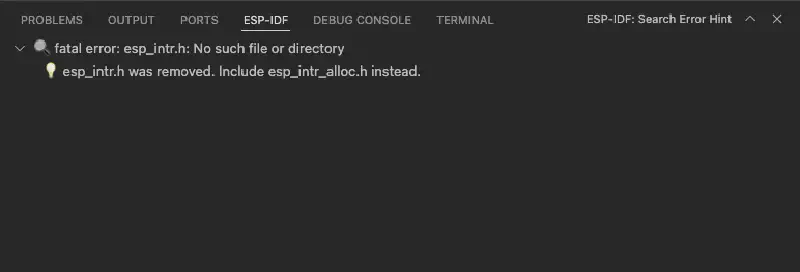
You can manually search for any ESP-IDF hint with the ESP-IDF: Search Error Hint. It will search from available hints listed in $IDF_PATH/tools/idf_py_actions/hints.yml.
Conclusion#
In this article, we introduced the key features implemented in ESP-IDF VS Code Extension v1.8.0 release. We are working hard to make the developer experience as smooth and convenient as possible, and this release moved us a few steps forward in this endeavor. We hope this version brings what you expected. If not, feel free to leave your feedback in GitHub issues, and let’s keep improving this extension together!