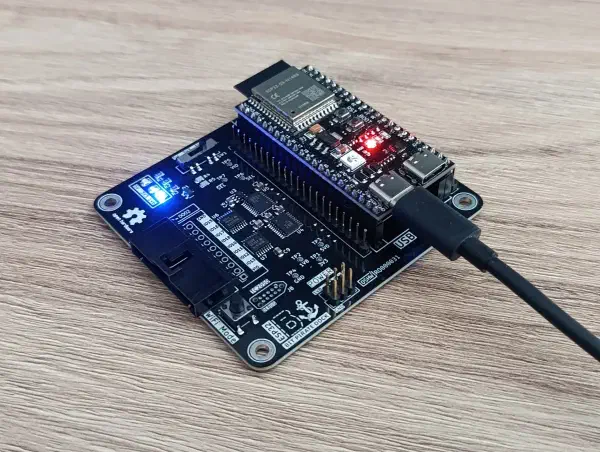
ESP32 Bit Pirate turns an ESP32-S3 into a scriptable multi-protocol workbench with more than twenty modes, a web and serial CLI, and dump and sniff tooling. This article walks through the firmware and the two open-hardware companions that extend it: a carrier dock with selectable 1.8 V, 3.3 V and 5 V level translation, and an ESP32-C5 adapter that adds a dual-band radio.
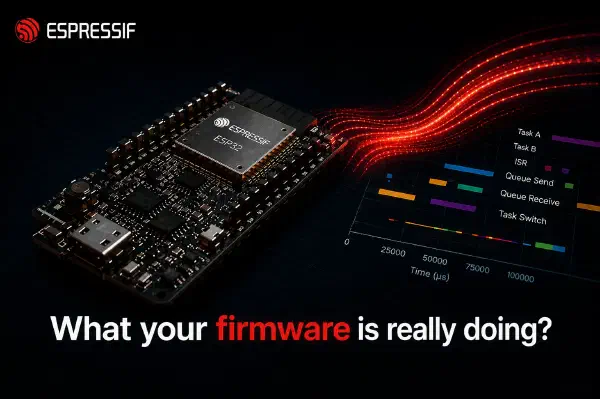
esp_trace is a new ESP-IDF component that splits application-level tracing into pluggable encoders and transports, so adding a new trace library no longer means patching the kernel. This post gives a high-level tour and walks through the example that demonstrates the integration.
Learn how Wokwi simulation and AI-assisted debugging solved a subtle RGB565 color mapping bug when porting Raylib to ESP32, turning hours of hardware debugging into an efficient iterative workflow with automated visual testing.
This two-part guide shows how to set up VS Code with the ESP-IDF extension to debug Espressif boards using JTAG. In this second part, we will debug a simple project using gdb through Espressif’s VSCode extension. We will explore the debugging options for navigating the code and inspecting the variables.
This two-part guide shows how to set up VS Code with the ESP-IDF extension to debug Espressif boards using JTAG. This first part covers the debugging process, hardware setup and connections, and starting the openOCD server.