
Power consumption measurement#
After completing Assignment 1, observe how TLS affects the energy used by a connected device. In this instructor-led demo, a Qoitech Otii Ace Pro Power Profiler measures the supply current of the ESP32-S31-Function-CoreBoard-1 during Wi-Fi startup and communication with a server.
The demo compares plain HTTP, a full TLS handshake, and a resumed TLS session. No student wiring is required.
Measurement setup#
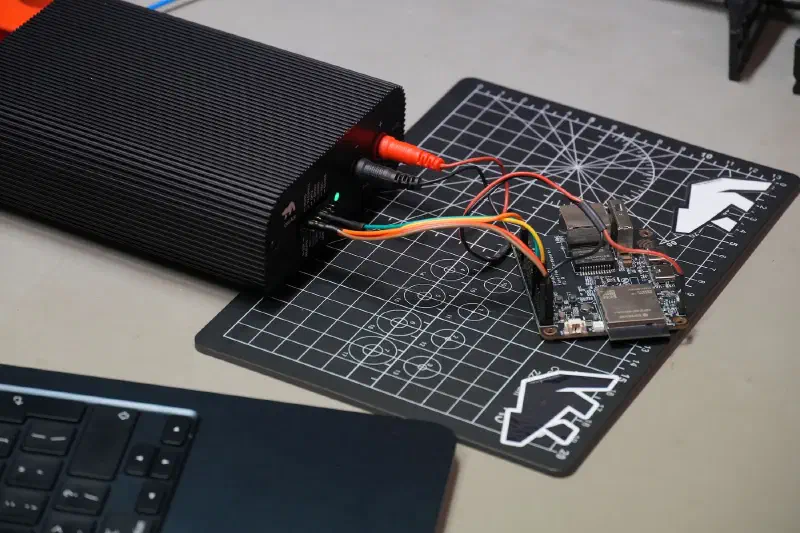
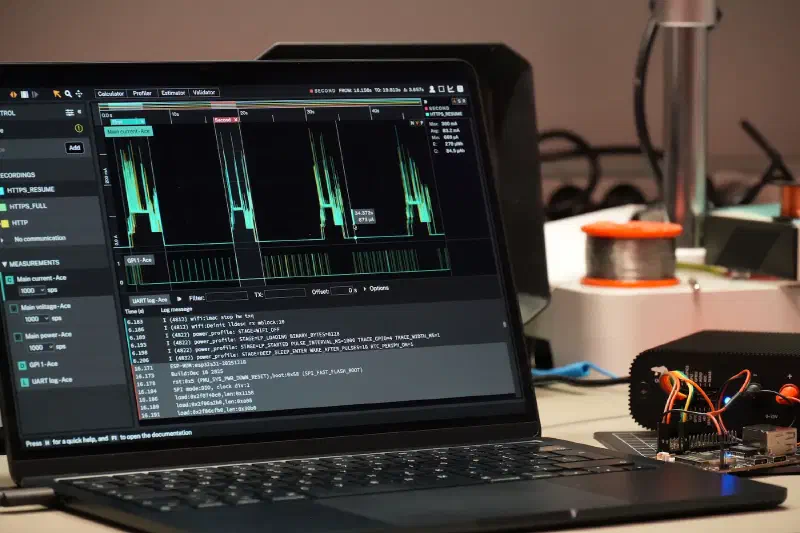
- Power: The Otii Ace Pro supplies power directly to the 3V3 rail of the ESP32-S31-Function-CoreBoard-1. The USB power path, voltage regulator, and other board circuitry are excluded, so the trace represents the current used by the ESP32-S31.
- Logs: The Otii Ace Pro also records the debug UART from the pin header. This output matches the output available through the USB-UART port. Each line is timestamped on the same timeline as the current trace, allowing firmware events such as Wi-Fi connection, TLS handshake, and data transmission to be correlated with changes in current.
Test cases#
The demo compares three variants of the same reporting flow. All variants use the same firmware, report, and server; only the transport changes. During each cycle, the board connects to Wi-Fi, sends a small report, and returns to deep sleep.
| Variant | What happens before data is sent |
|---|---|
| HTTP (baseline) | Wi-Fi connection, DHCP, and TCP connection |
| HTTPS, full handshake | Everything in the HTTP flow, plus certificate verification and an ECDHE key exchange with one additional round trip |
| HTTPS, resumed session | Everything in the HTTP flow, plus a short handshake using a session ticket from the previous connection. The ticket is stored in LP memory, which remains powered during deep sleep. Certificate verification and the key exchange are skipped. |
If the session ticket has expired or the server rejects it, the board falls back to a full TLS handshake.
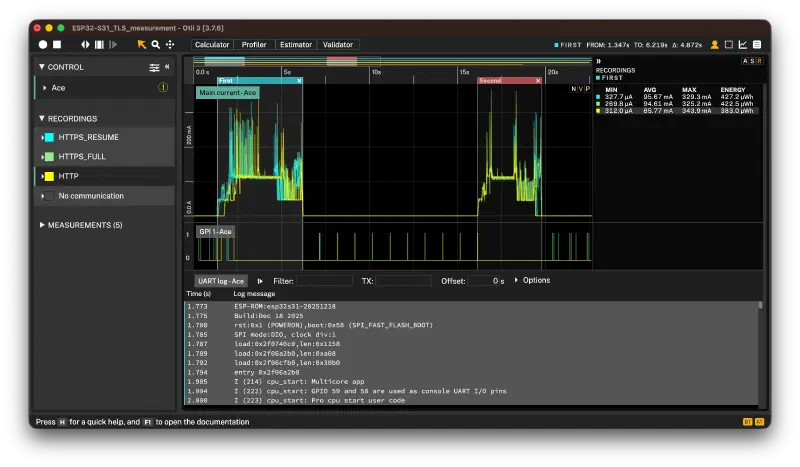
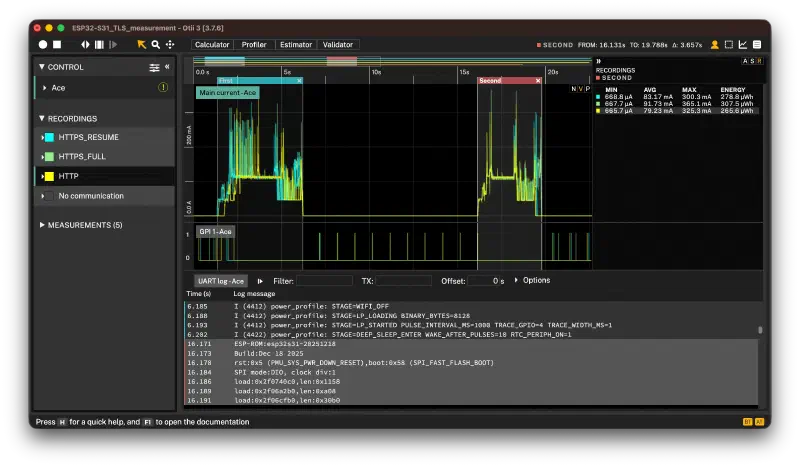
Each recording contains four reporting cycles. The first two are analyzed below and are marked First and Second in the Otii project:
- First: A cold boot after a power-on reset. No session ticket exists, so both HTTPS variants perform a full handshake.
- Second: A wake-up from deep sleep about 10 seconds later. Wi-Fi reconnects faster using information from the previous connection, and the HTTPS resumed-session variant offers its stored session ticket.
The third and fourth cycles are additional wake-ups from deep sleep that can be used to check how consistent the results are across cycles.
This comparison is not an argument against TLS. Security should always be a priority in connected devices. The purpose is to quantify TLS overhead so that it can be included in battery-life estimates and reporting-interval decisions.
Results#
The tables show the First and Second selections from the Otii project. Each selection covers the same interval for all three recordings and includes boot, Wi-Fi connection, transmission of the report, and entry into deep sleep. The percentage in Compared to HTTP is the difference in energy relative to the HTTP baseline.
First selection: Cold boot#
| Variant | Active time per report | Energy per report | Average current | Compared to HTTP |
|---|---|---|---|---|
| HTTP | 4.43 s | 383.0 µWh | 85.77 mA | Baseline |
| HTTPS, full handshake | 4.75 s | 422.5 µWh | 94.61 mA | +10.3% |
| HTTPS, resumed session (no ticket yet) | 4.84 s | 427.2 µWh | 95.67 mA | +11.5% |
Second selection: Wake-up from deep sleep#
| Variant | Active time per report | Energy per report | Average current | Compared to HTTP |
|---|---|---|---|---|
| HTTP | 3.24 s | 265.6 µWh | 79.23 mA | Baseline |
| HTTPS, full handshake | 3.59 s | 307.5 µWh | 91.73 mA | +15.8% |
| HTTPS, resumed session | 3.32 s | 278.8 µWh | 83.17 mA | +5.0% |
Analyze the measurements yourself#
The recordings are available as an Otii project. You can open and analyze them without connecting measurement hardware:
- Download and install the free Otii Desktop Application, available for Windows, macOS, and Ubuntu.
- Download the
ESP32-S31_TLS_measurement.otii3.zipdemo project. - Open the project in Otii. It contains one recording for each variant:
HTTP,HTTPS_FULL, andHTTPS_RESUME. Each recording includes the current trace and UART log for four reporting cycles. - Open the First and Second selections to view the minimum, average, and maximum current and the energy used by all three recordings.
- Select a recording in the Recordings list to inspect its UART log.
- Use the selection tool to create temporary selections and analyze the third and fourth cycles or a specific activity within the first two cycles.
For more information about selections and measurement analysis, see the Otii documentation.
Previous and next steps#
Previous: Assignment 1: Establish and verify a TLS connection